Fig. 8
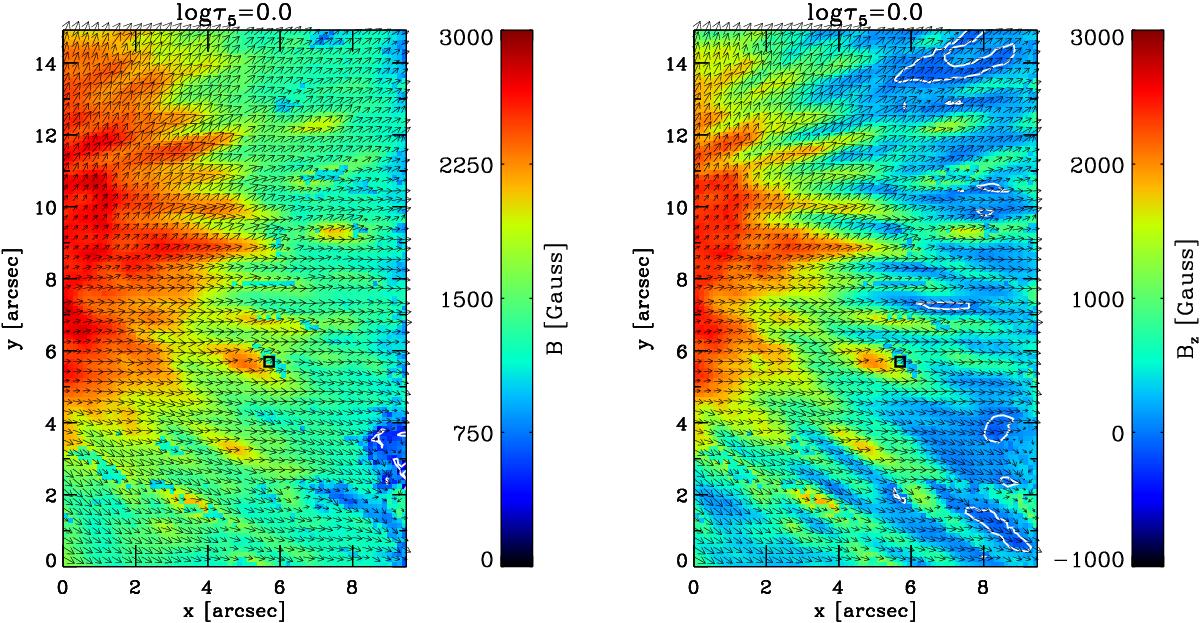
Magnetic field strength B(x,y,log τ5 = 0) (left) and vertical component of the magnetic field in the local reference frame Bz(x,y,log τ5 = 0) (right) in NOAA 12049 observed on May 3, 2014 at Θ = 6.5°. White contours in the left and right panels indicate regions where B< 500 Gauss and Bz< 0, respectively. Black arrows indicate the projection of the magnetic field vector B onto the plane of the solar surface. This region corresponds to the red rectangle in Fig. 1 (bottom panel). This map was obtained from inverting the deconvolved data assuming pw = 0.2 (20% wide-angle scattered light).
Current usage metrics show cumulative count of Article Views (full-text article views including HTML views, PDF and ePub downloads, according to the available data) and Abstracts Views on Vision4Press platform.
Data correspond to usage on the plateform after 2015. The current usage metrics is available 48-96 hours after online publication and is updated daily on week days.
Initial download of the metrics may take a while.