Fig. 6
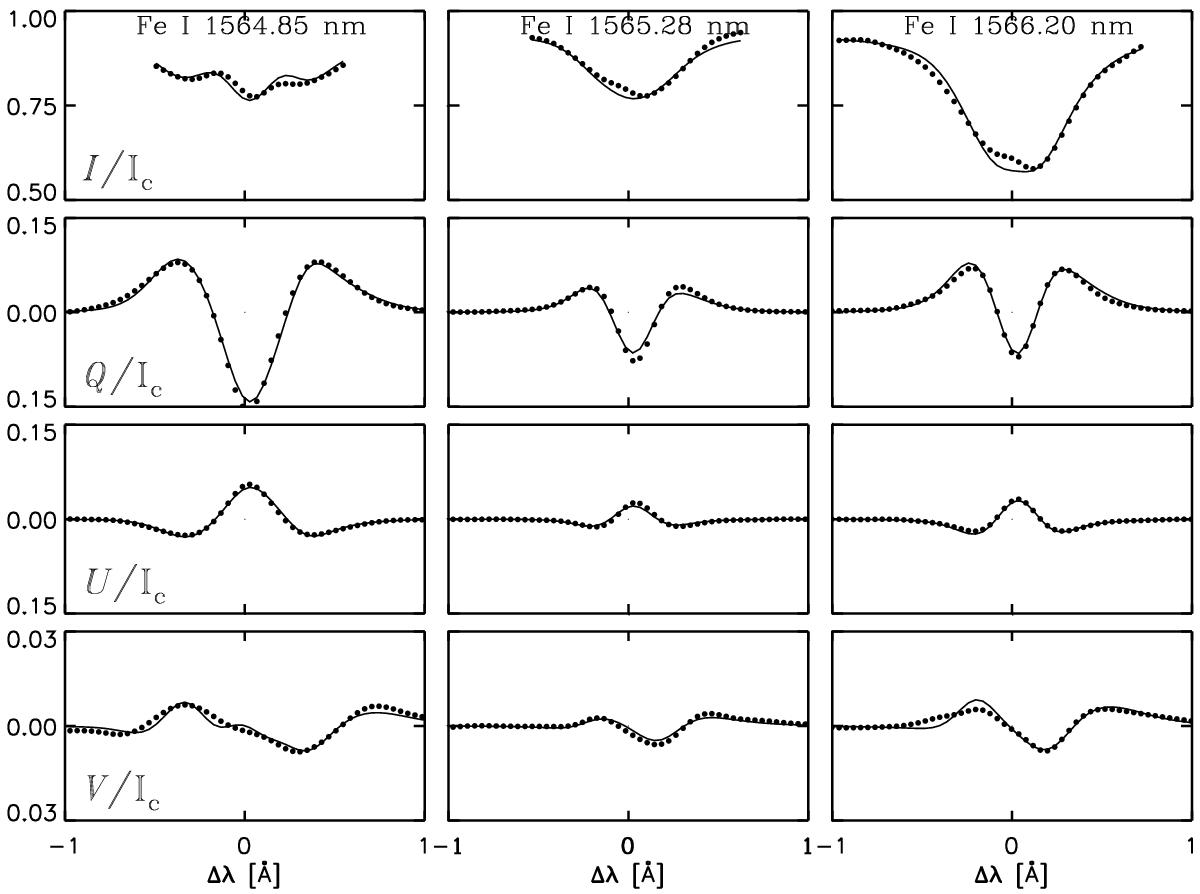
Example of the observed (after PCA deconvolution; filled circles) and best-fit (solid lines) Stokes profiles resulting from the inversion (see Sect. 4.3) in a intraspinal pixel. From top to bottom: results for I, Q, U, and V. From left to right: results for Fe I 1565.85 nm, Fe I 1565.28 nm, and Fe I 1566.20 nm (see Table 1). The location of this particular pixel is indicated in Fig. 8 with a black square.
Current usage metrics show cumulative count of Article Views (full-text article views including HTML views, PDF and ePub downloads, according to the available data) and Abstracts Views on Vision4Press platform.
Data correspond to usage on the plateform after 2015. The current usage metrics is available 48-96 hours after online publication and is updated daily on week days.
Initial download of the metrics may take a while.