Fig. 2
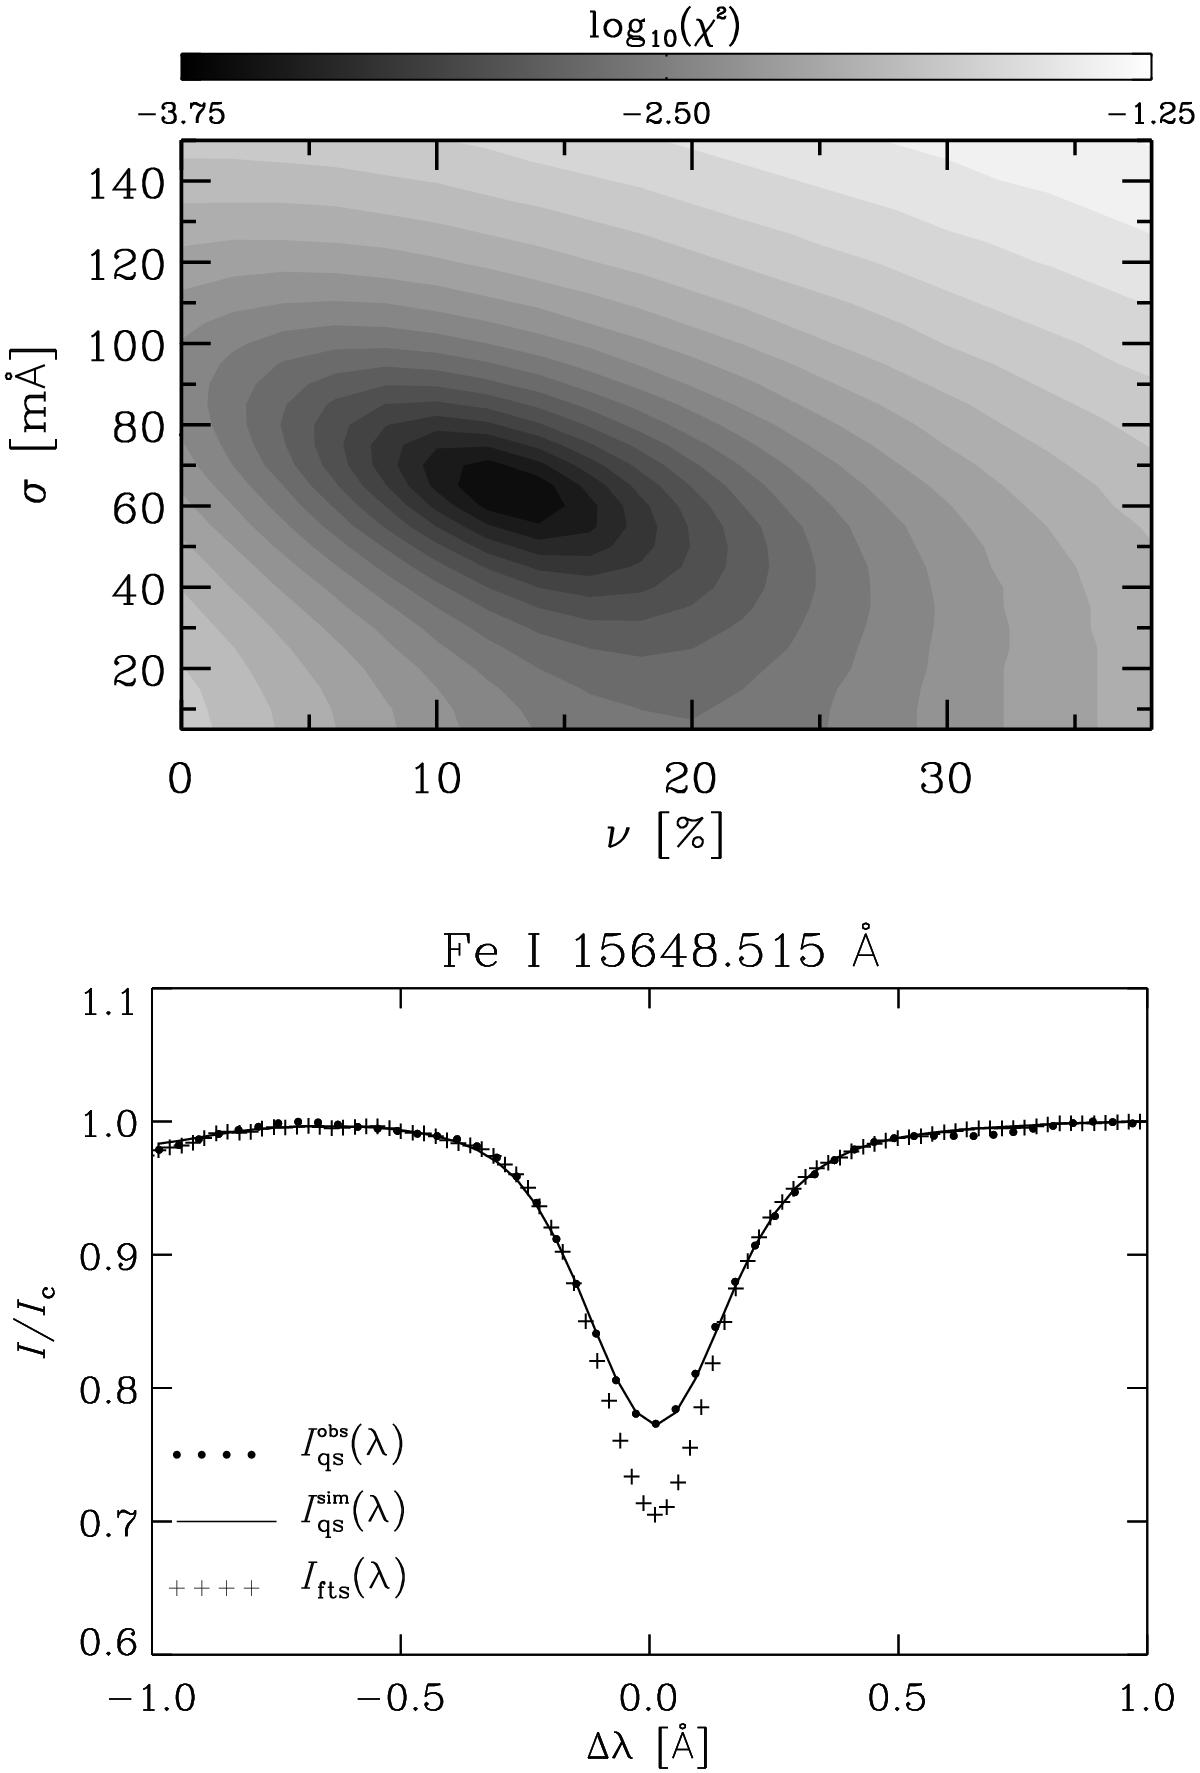
Top panel: χ2-surface as a function of the parameters ν and σ defining the spectrograph profile (Eq. (2)). This surface was obtained from comparing the observed (![]() ) and simulated (
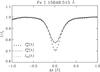
) and simulated (![]() ) quiet-Sun intensity profile of the Fe i line at 1564.8 nm. Bottom panel: FTS intensity profile of Fe i 1564.8 nm Ifts (crosses), simulated average quiet-Sun intensity profile obtained after applying the spectrograph profile to FTS data
) quiet-Sun intensity profile of the Fe i line at 1564.8 nm. Bottom panel: FTS intensity profile of Fe i 1564.8 nm Ifts (crosses), simulated average quiet-Sun intensity profile obtained after applying the spectrograph profile to FTS data ![]() (solid line), and observed average quiet-Sun intensity profile from GRIS data
(solid line), and observed average quiet-Sun intensity profile from GRIS data ![]() in NOAA 12049 (filled circles; see also blue dashed rectangles in Fig. 1).
in NOAA 12049 (filled circles; see also blue dashed rectangles in Fig. 1).
Current usage metrics show cumulative count of Article Views (full-text article views including HTML views, PDF and ePub downloads, according to the available data) and Abstracts Views on Vision4Press platform.
Data correspond to usage on the plateform after 2015. The current usage metrics is available 48-96 hours after online publication and is updated daily on week days.
Initial download of the metrics may take a while.