Fig. 10
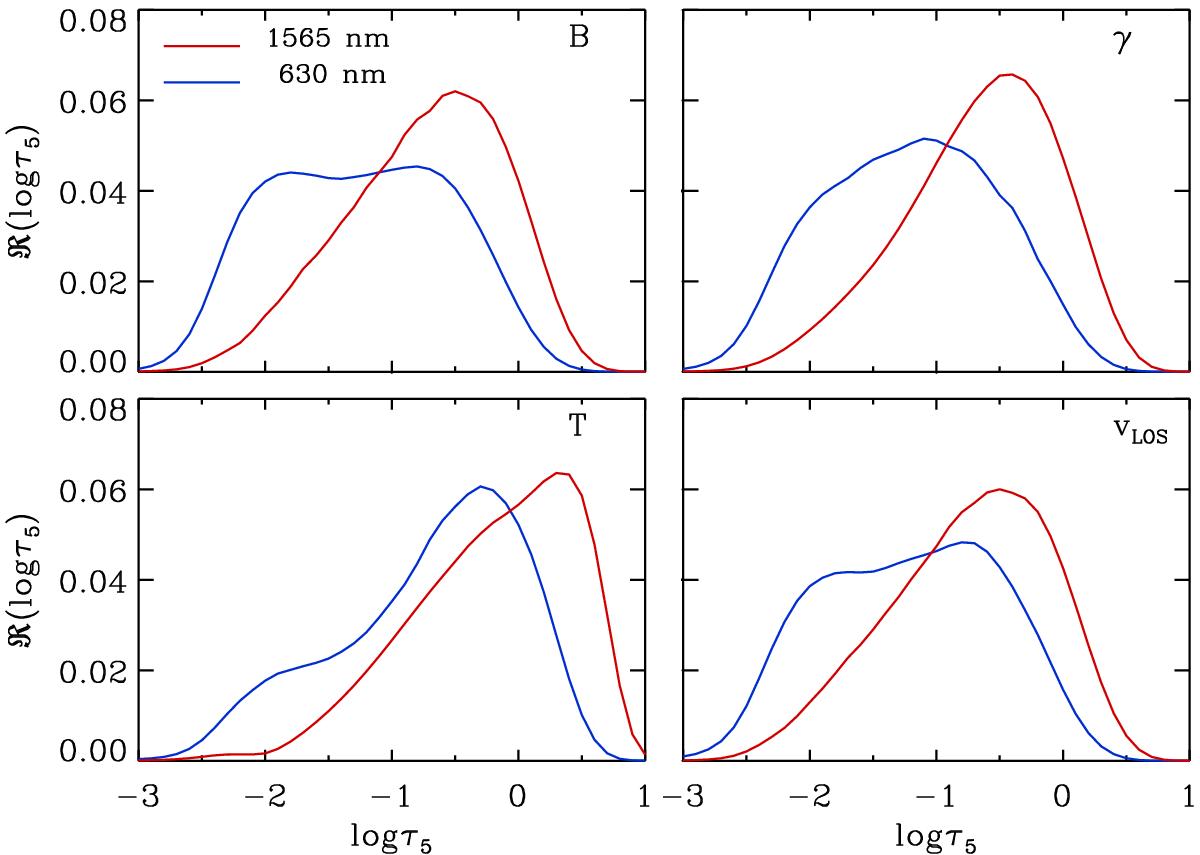
Wavelength-integrated response function ℛ as a function of the logarithm of the optical depth at a reference wavelength of 500 nm, log τ5, to the magnetic field strength B (top left), magnetic field inclination with respect to the observer line of sight γ (top right), temperature T (lower left), and line-of-sight velocity vlos (lower right). Red curves correspond to the integration over the observed spectral lines in this work (see Table 1), while the blue lines correspond to a wavelength integration over the Fe i line pair at 630 nm. The atmospheric model employed to calculate the response functions is the spatially averaged penumbral model obtained from the inversions (see Sect. 4.3).
Current usage metrics show cumulative count of Article Views (full-text article views including HTML views, PDF and ePub downloads, according to the available data) and Abstracts Views on Vision4Press platform.
Data correspond to usage on the plateform after 2015. The current usage metrics is available 48-96 hours after online publication and is updated daily on week days.
Initial download of the metrics may take a while.