Fig. 1
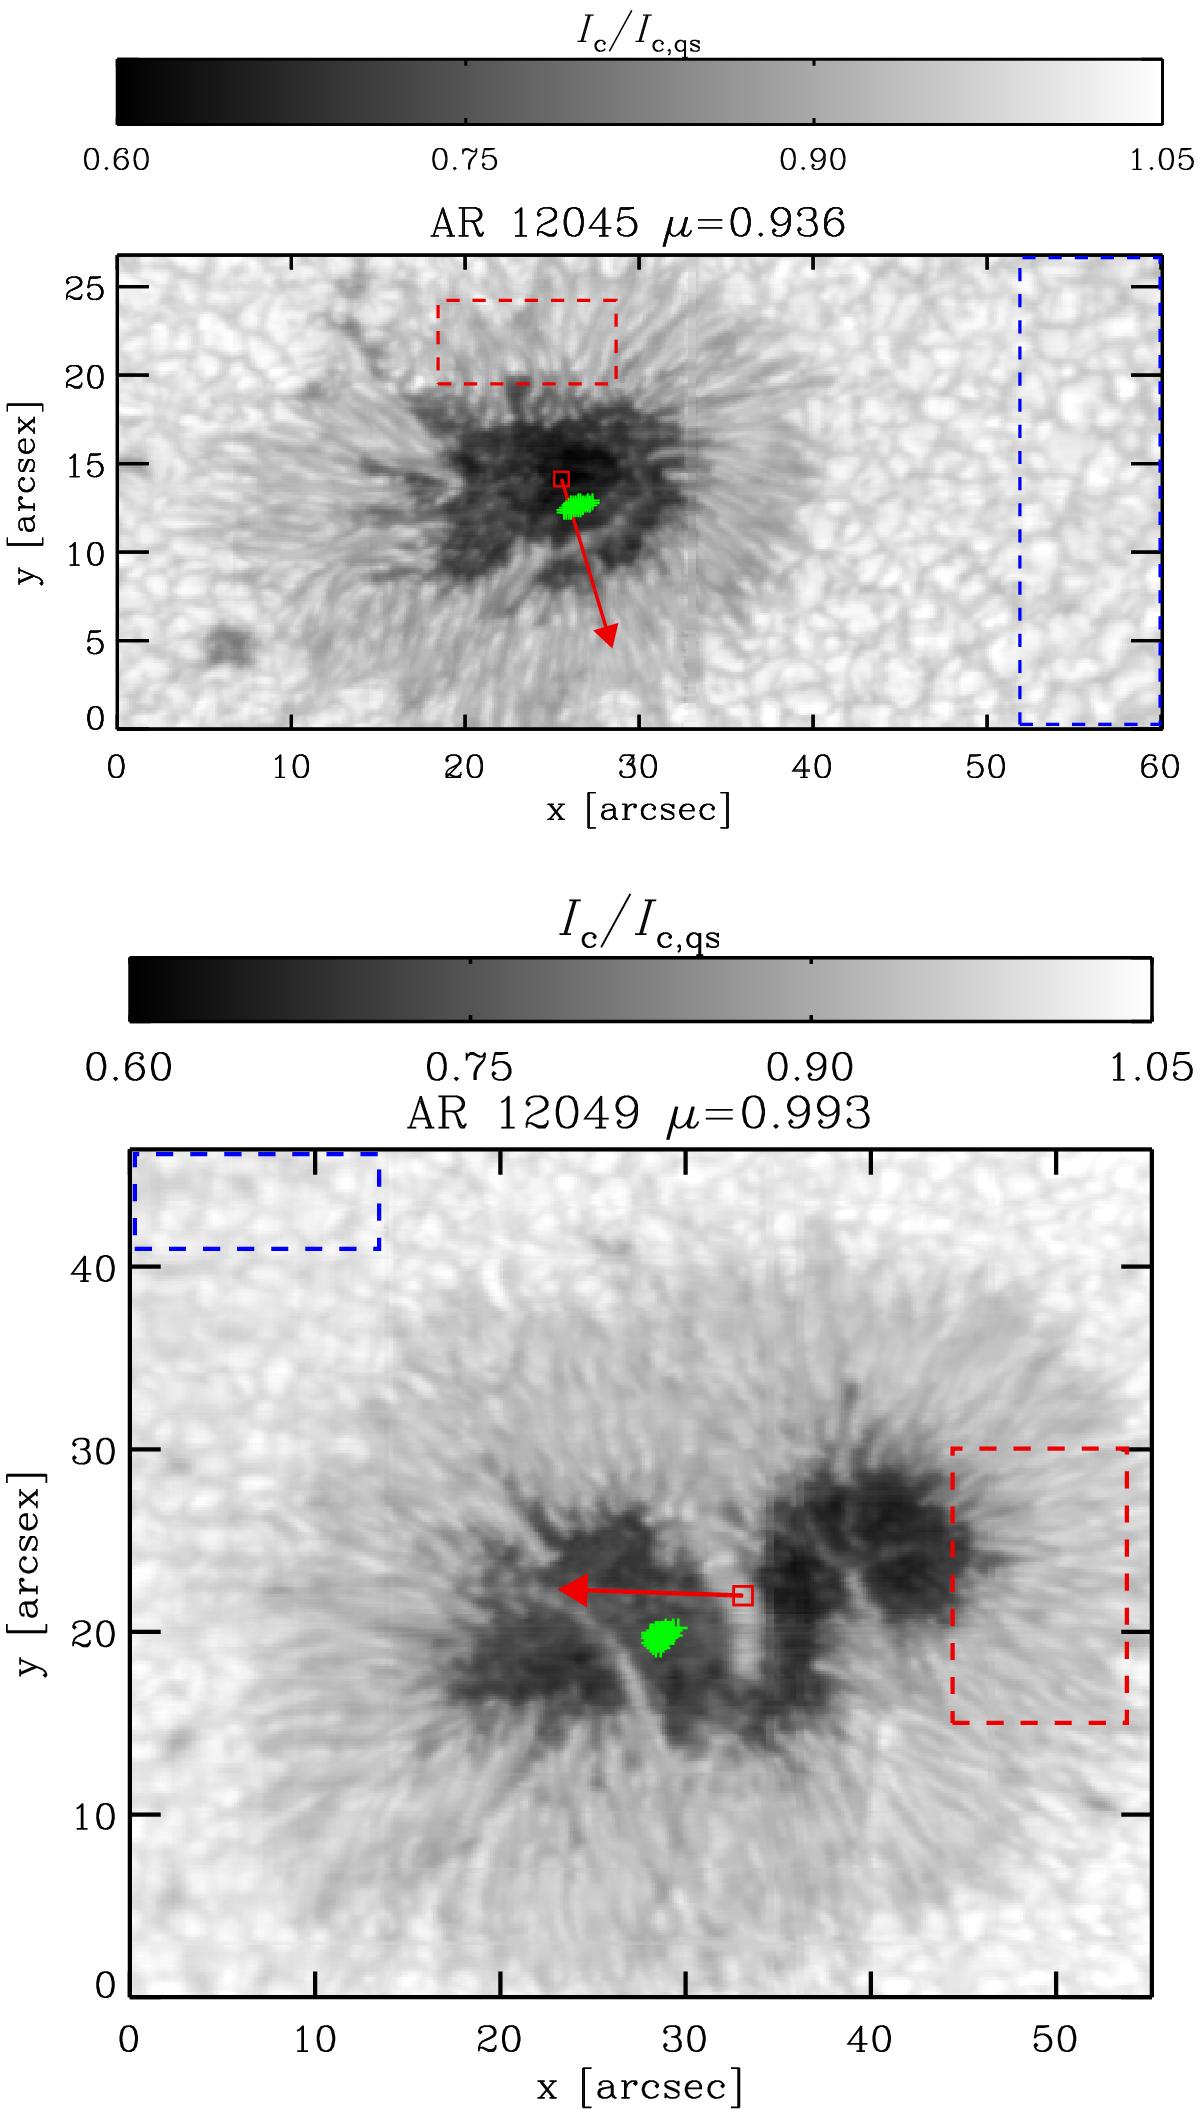
Continuum intensity Ic (at 1565 nm) of NOAA 12045 (top) and leading spot of NOAA 12049 (bottom) normalized to the quiet-Sun continuum (Ic,qs) as observed with the GREGOR Infrared Spectrograph (GRIS) on April 24, 2014 and May 3, 2015, respectively. The red squares denote the center of each sunspot: (x,y) = (125″,−309″) for NOAA 12045 and (x,y) = (73″,−83″) for NOAA 12049. The red arrow points toward the center of the solar disk. The areas enclosed by the blue dashed rectangles have been used for calibration purposes (e.g., to calculate the normalization factor Ic,qs; see also Sect. 3), while the areas enclosed by the red dashed rectangles indicate the regions that have been analyzed in our work (see Sects. 4.3 and 5). The scanning direction (i.e., direction of movement of the spectrograph slit) was from top to bottom along the y-axis.
Current usage metrics show cumulative count of Article Views (full-text article views including HTML views, PDF and ePub downloads, according to the available data) and Abstracts Views on Vision4Press platform.
Data correspond to usage on the plateform after 2015. The current usage metrics is available 48-96 hours after online publication and is updated daily on week days.
Initial download of the metrics may take a while.