Free Access
Fig. 4
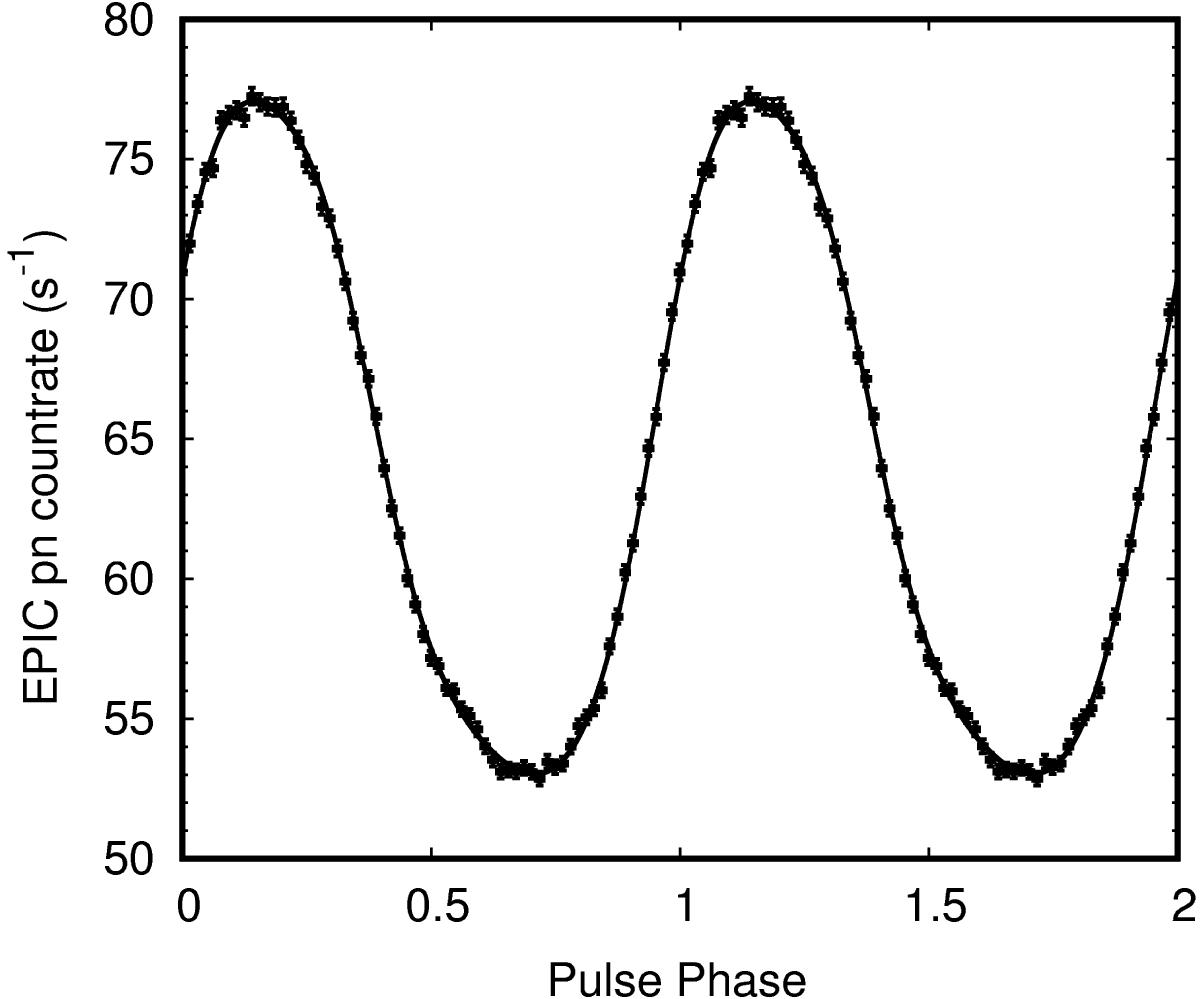
0.3–10 keV pulse profile of IGR J17511–3057 as observed by the EPIC pn during the 2015 outburst. The best-fitting model (solid line) is composed of four harmonics with background subtracted rms amplitudes of 14.31(6)%, 1.53(6)%, 0.72(6)%, and 0.26(6)%. Two cycles are shown for clarity.
Current usage metrics show cumulative count of Article Views (full-text article views including HTML views, PDF and ePub downloads, according to the available data) and Abstracts Views on Vision4Press platform.
Data correspond to usage on the plateform after 2015. The current usage metrics is available 48-96 hours after online publication and is updated daily on week days.
Initial download of the metrics may take a while.