Fig. 3
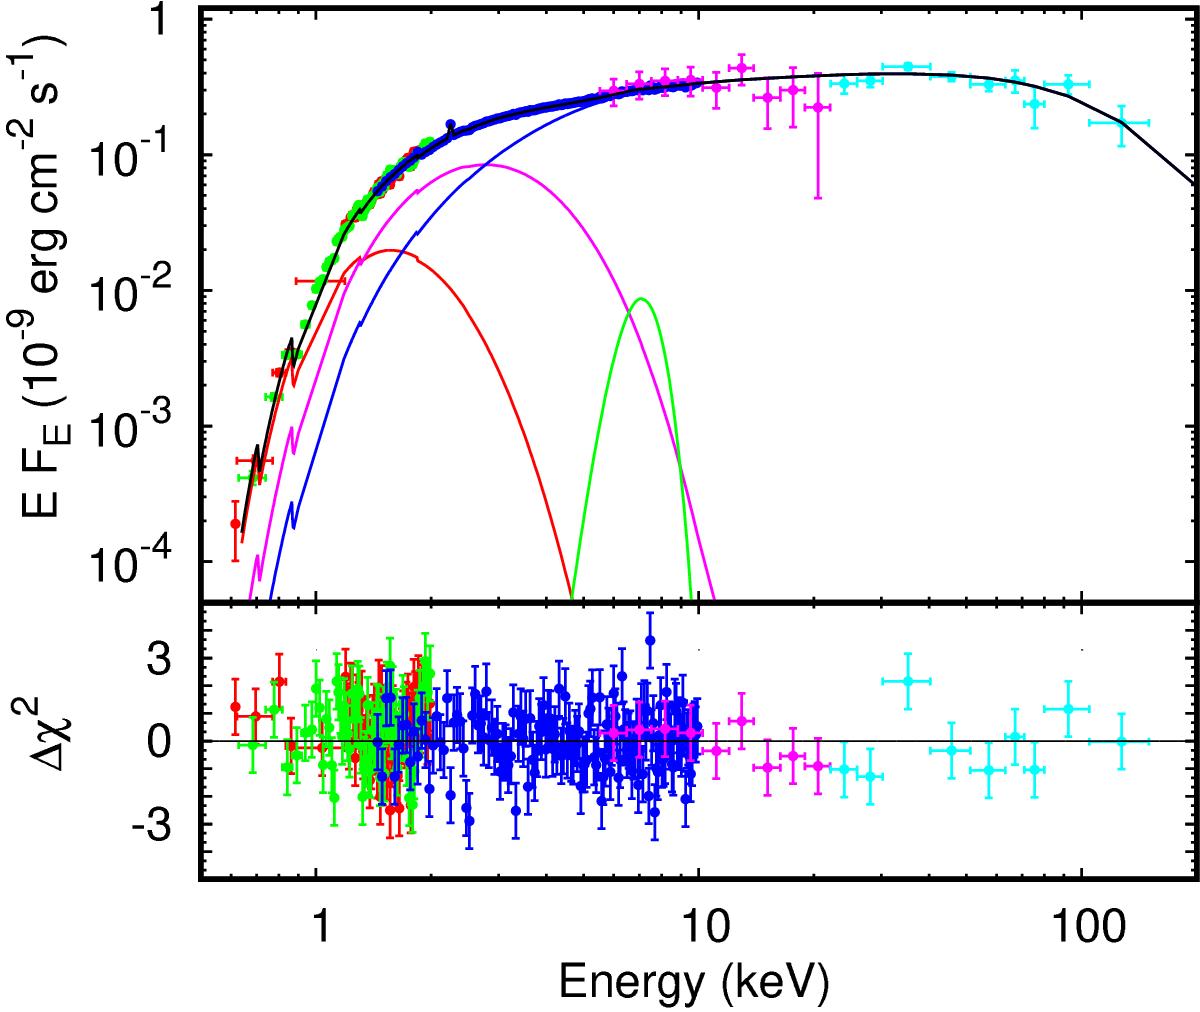
Top panel: X-ray spectrum of IGR J17511–3057 observed by the EPIC-pn (blue points), RGS1 (red points), RGS2 (green points), JEM-X (magenta points), and ISGRI (cyan points) during the 2015 outburst. RGS1 and RGS2 spectra were rebinned for graphical purposes. The best-fit model (black line), the Fe line (green line), the disk (red line), single-temperature black body (magenta line), and the Comptonized (blue line) spectra are also shown. Bottom panel: residuals with respect to the best-fit model.
Current usage metrics show cumulative count of Article Views (full-text article views including HTML views, PDF and ePub downloads, according to the available data) and Abstracts Views on Vision4Press platform.
Data correspond to usage on the plateform after 2015. The current usage metrics is available 48-96 hours after online publication and is updated daily on week days.
Initial download of the metrics may take a while.