Fig. 2
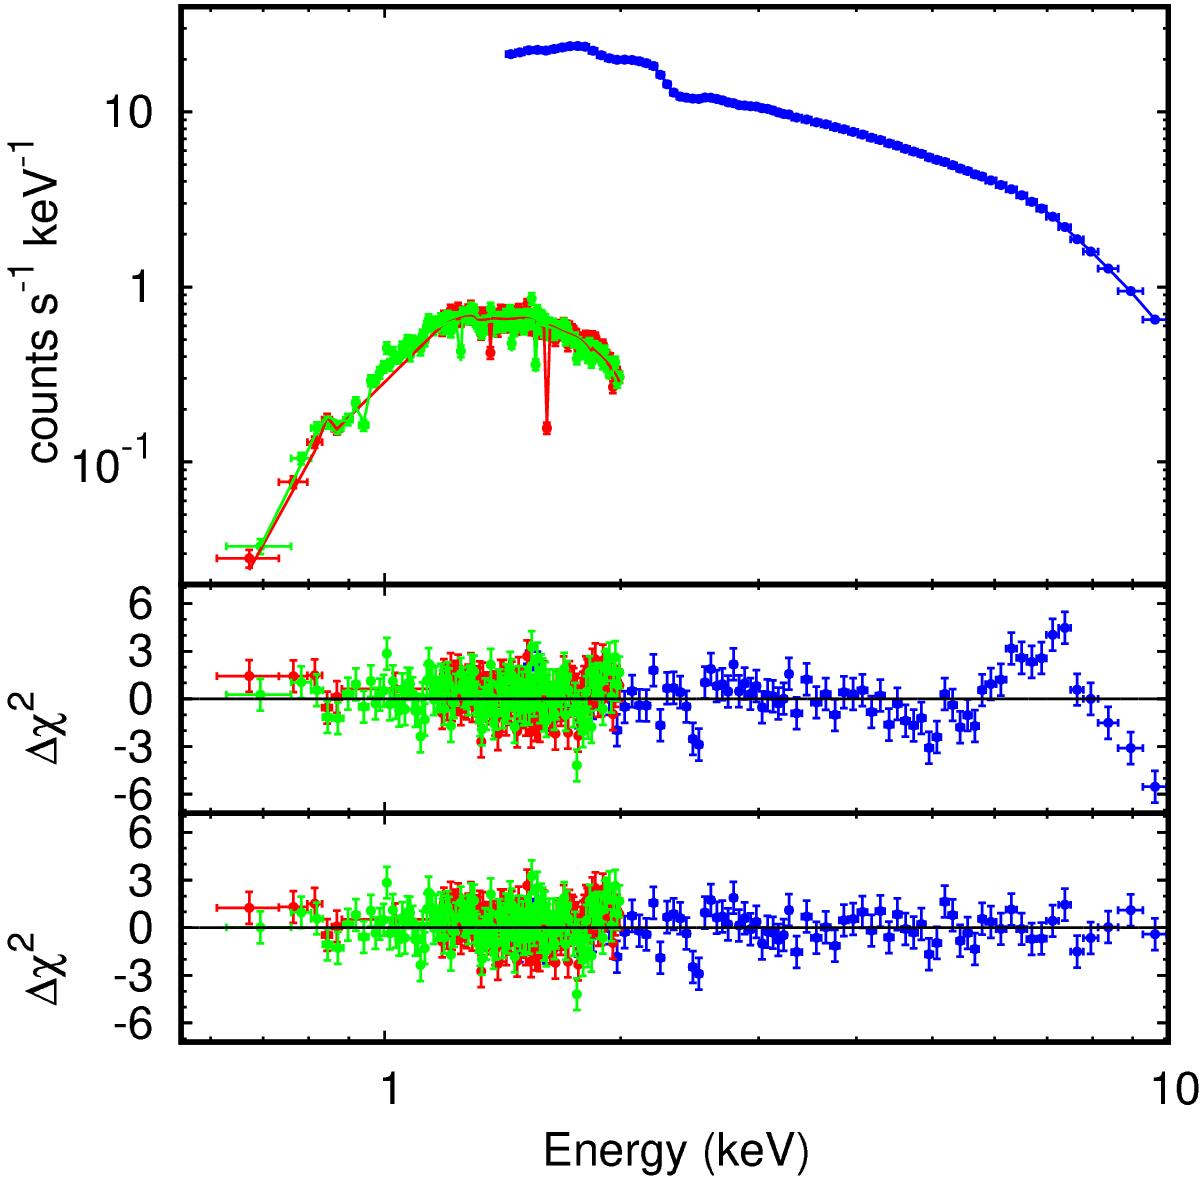
Top panel: X-ray spectrum of IGR J17511–3057 observed by the EPIC-pn (blue points), RGS1 (red points), and RGS2 (green points) during the XMM-Newton observation. Spectra were rebinned for graphical purposes. Bottom and middle panels: residuals with respect to the model listed in the central column of Table 2 (see text for details), with and without the addition of an emission line centred at ![]() keV to the model, respectively.
keV to the model, respectively.
Current usage metrics show cumulative count of Article Views (full-text article views including HTML views, PDF and ePub downloads, according to the available data) and Abstracts Views on Vision4Press platform.
Data correspond to usage on the plateform after 2015. The current usage metrics is available 48-96 hours after online publication and is updated daily on week days.
Initial download of the metrics may take a while.