Fig. 3
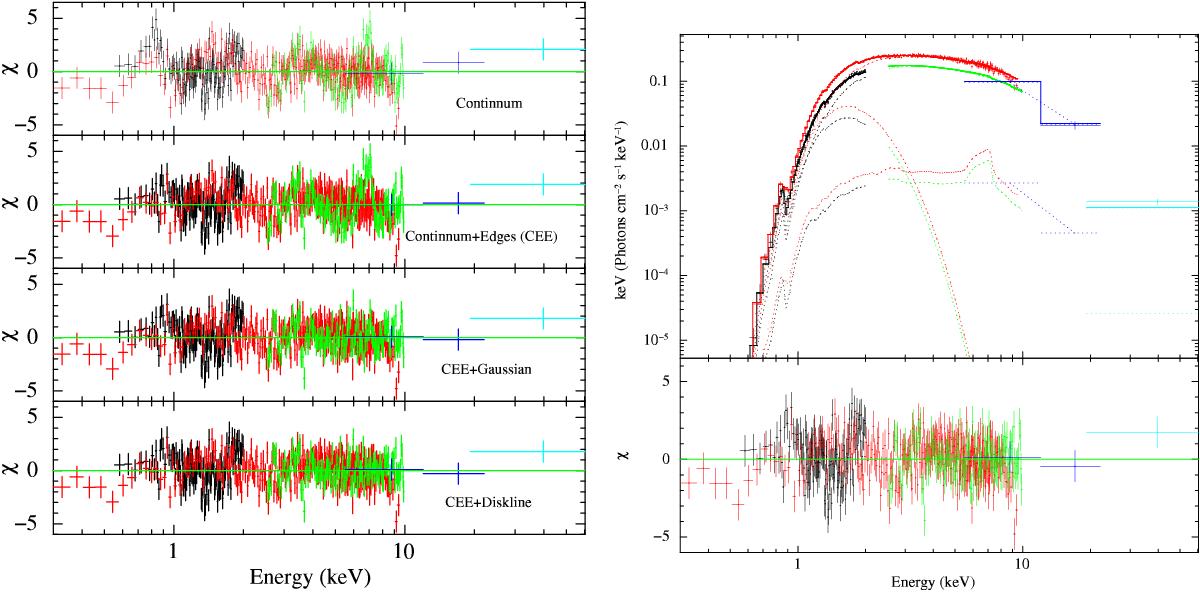
Left panel: 0.3–60 keV residuals corresponding to the trial models (see Table 1) described in the text. Right panel: unfolded spectrum and residuals corresponding to the model CEE+Reflection. The red, black, green, blue, and light-blue data correspond to MOS12, RGS12, EPIC-pn, JEM-X2, and ISGRI spectra, respectively. The shown data are graphically rebinned.
Current usage metrics show cumulative count of Article Views (full-text article views including HTML views, PDF and ePub downloads, according to the available data) and Abstracts Views on Vision4Press platform.
Data correspond to usage on the plateform after 2015. The current usage metrics is available 48-96 hours after online publication and is updated daily on week days.
Initial download of the metrics may take a while.