Fig. 1
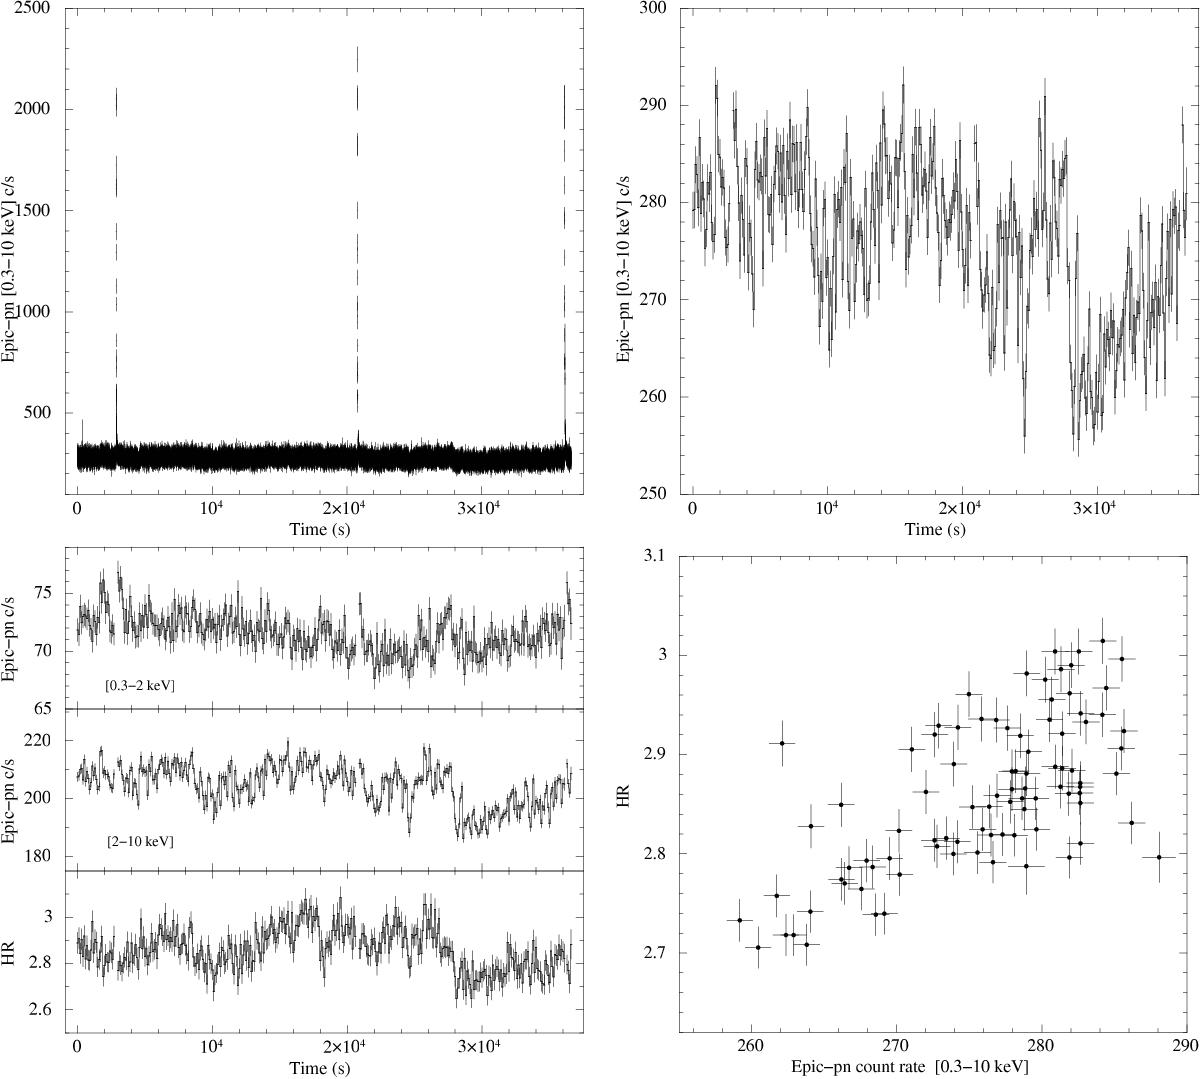
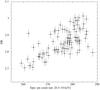
Top-left panel: EPIC-pn light curve of 4U 1702-429 with a bin time of 1 s. Three type-I X-ray bursts occur during the observation: between 2860 and 2980 s, 20 780 and 20 900 s, and 36 150 and 36 300 s from the start time. Top-right panel: 0.3–10 keV EPIC-pn persistent light curve. The bin time is 100 s. Bottom-left panel: 0.3–2 keV EPIC-pn persistent light curve (upper panel), 2–10 keV EPIC-pn persistent light curve (middle panel) and the corresponding HR (lower panel). The bin time is 100 s. Bottom-right panel: HR vs. intensity (bin time of 400 s).
Current usage metrics show cumulative count of Article Views (full-text article views including HTML views, PDF and ePub downloads, according to the available data) and Abstracts Views on Vision4Press platform.
Data correspond to usage on the plateform after 2015. The current usage metrics is available 48-96 hours after online publication and is updated daily on week days.
Initial download of the metrics may take a while.