Fig. 9
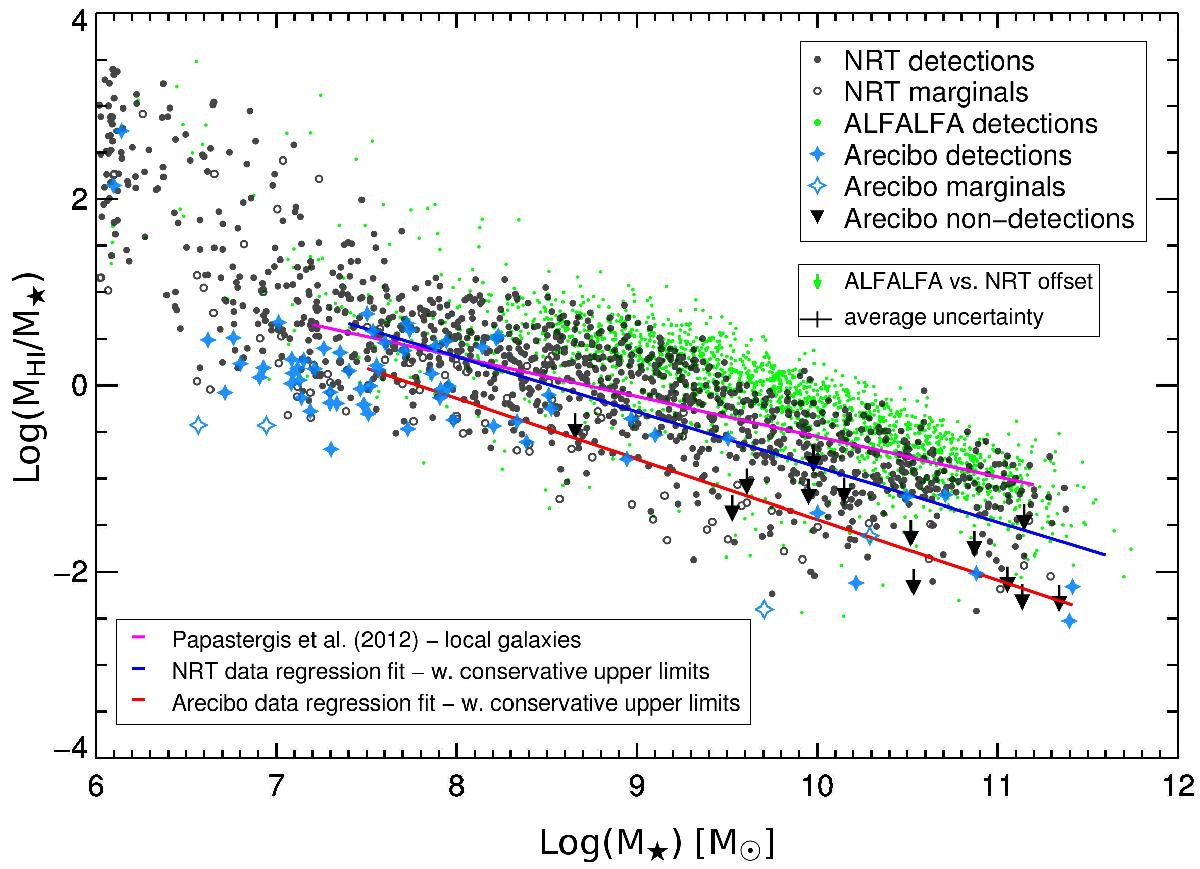
Hi mass fraction (MHI/M⋆) as a function of total stellar mass, M⋆(in M⊙). NIBLES Nançay detections and marginals are represented by gray dots and open circles respectively while ALFALFA detections are represented by green dots. Our follow-up Arecibo detections and marginals are represented by solid and open light blue stars respectively while upper limits for non-detections are shown as downward arrows. Stellar masses used were taken from the SDSS added-value MPA-JHU catalogs (see Sect. 4). The green arrow below the legend represents the 0.16 dex average offset between the ALFALFA and NIBLES Hi masses due to flux scale differences and the black cross indicates the average uncertainty in the stellar masses and mass fractions (about 20% in both cases). The magenta line represents the fit to literature reference samples of Hi-detected galaxies from Papastergis et al. (2012), the blue and red lines represent the regression fits to the Nançay and Arecibo sources, respectively, which include estimated upper limits to Hi masses of undetected galaxies (see Paper I for further details).
Current usage metrics show cumulative count of Article Views (full-text article views including HTML views, PDF and ePub downloads, according to the available data) and Abstracts Views on Vision4Press platform.
Data correspond to usage on the plateform after 2015. The current usage metrics is available 48-96 hours after online publication and is updated daily on week days.
Initial download of the metrics may take a while.