Fig. 8
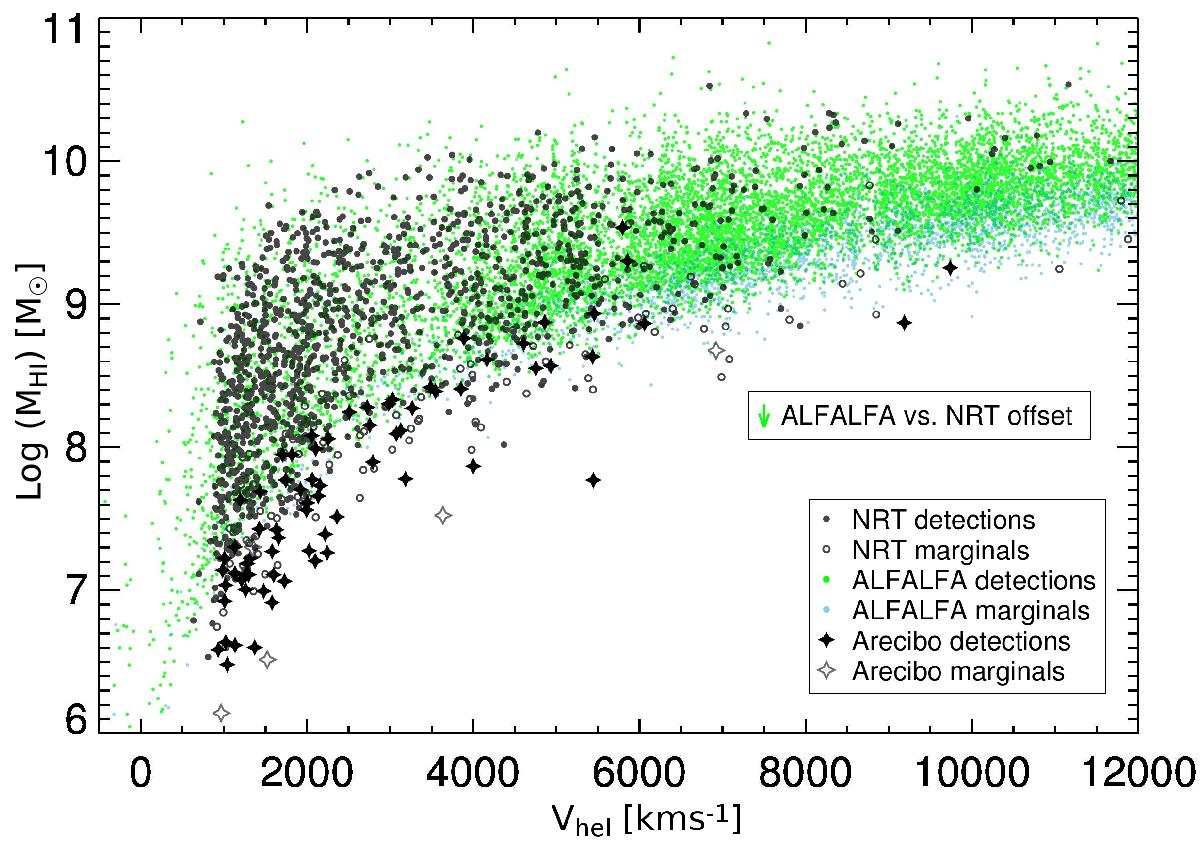
Total Hi mass, MHI (in M⊙), as a function of Hi radial velocity (in km s-1). Shown are the NIBLES detections and marginals from both our Arecibo and Nançay observations (black stars and dots respectively), together with data based on the ALFALFA α.40 catalog (Haynes et al. 2011), where green dots represent detections (their Category 1) and light blue dots represent marginals (Category 2). Excluded were all NIBLES detections which are definitely or probably confused by another galaxy within the telescope beam, as well as detections that are likely resolved (see Paper I). The Hi masses of the ALFALFA detections were calculated in the same way as for the NIBLES sources, using simply a distance of D = V/H0, where the adopted Hubble constant is H0 = 70 km s-1 Mpc-1. The green vertical arrow above the legend indicates the difference of 0.16 in log(MHI) corresponding to the mean Hi flux scale difference between the α.40 catalog and our NRT data.
Current usage metrics show cumulative count of Article Views (full-text article views including HTML views, PDF and ePub downloads, according to the available data) and Abstracts Views on Vision4Press platform.
Data correspond to usage on the plateform after 2015. The current usage metrics is available 48-96 hours after online publication and is updated daily on week days.
Initial download of the metrics may take a while.