Fig. 7
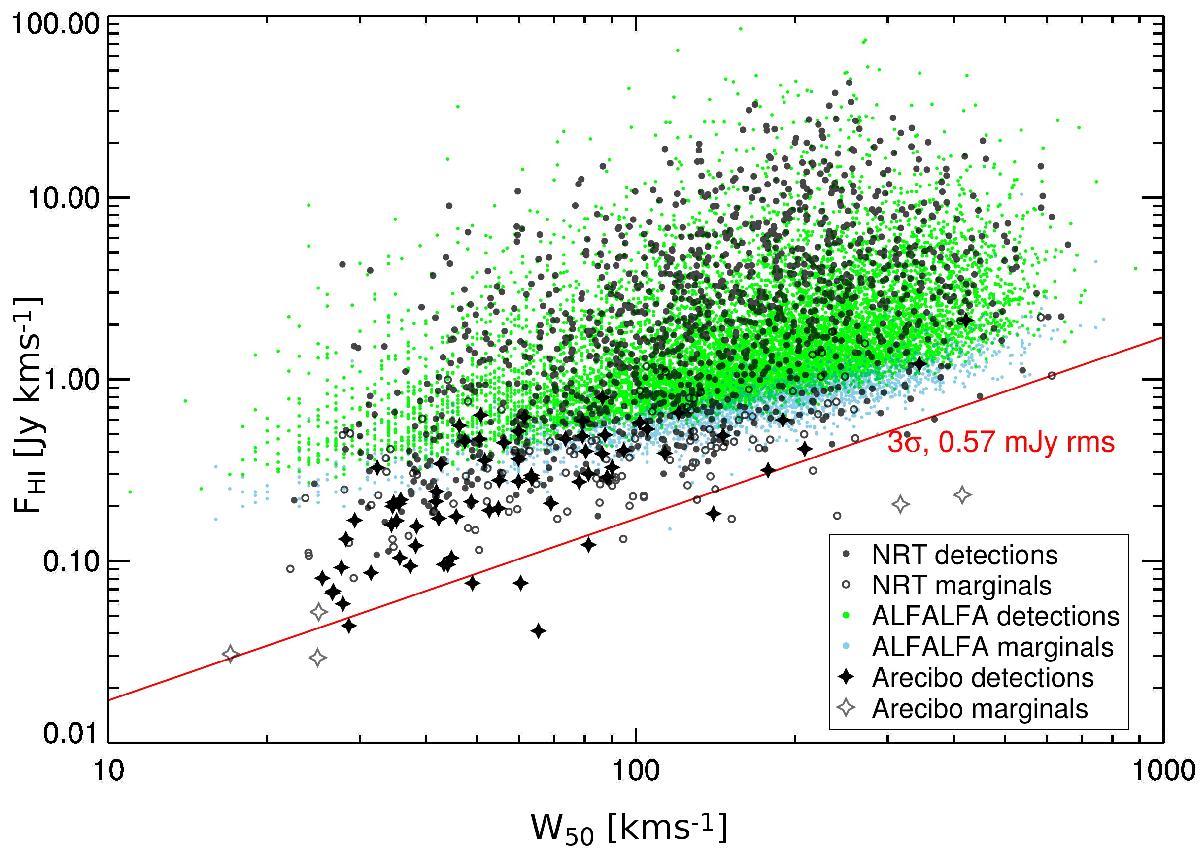
Integrated Hi line flux FHI (in Jy km s-1) as a function of W50 line width (in km s-1). Shown are the NIBLES non-confused and non-resolved detections and marginals from both our Arecibo and Nançay observations, together with the ALFALFA data from the α.40 catalog (Haynes et al. 2011), where green dots represent detections (their Category 1) and light blue dots represent marginals (Category 2). The red line indicates the integrated line flux from a 3σ flat-topped profile with a 0.57 mJy rms noise level.
Current usage metrics show cumulative count of Article Views (full-text article views including HTML views, PDF and ePub downloads, according to the available data) and Abstracts Views on Vision4Press platform.
Data correspond to usage on the plateform after 2015. The current usage metrics is available 48-96 hours after online publication and is updated daily on week days.
Initial download of the metrics may take a while.