Fig. 2
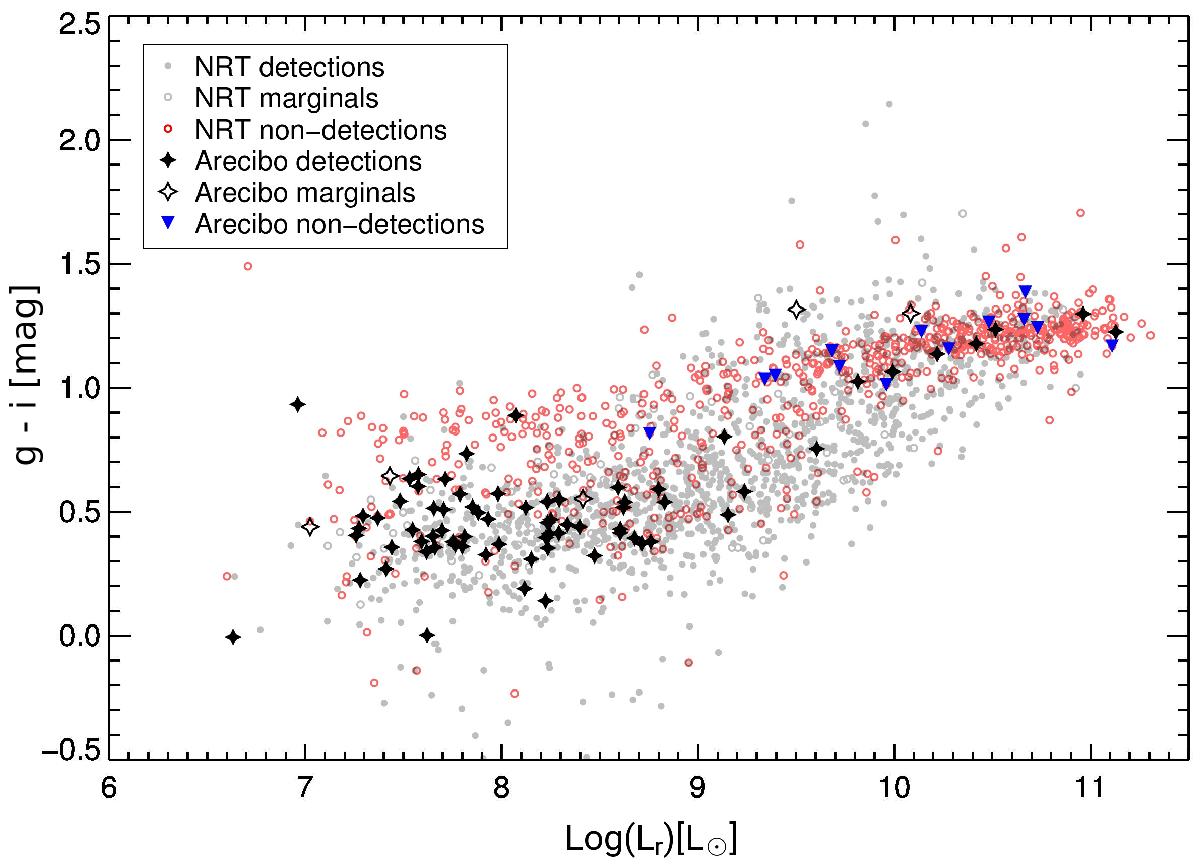
Integrated g−i color, in mag, as function of absolute r-band luminosity, log(Lr) in L⊙, both corrected for Galactic extinction following Schlegel et al. (1998). Nançay detections, marginals, and non-detections are represented by gray dots, open gray circles, and open red circles respectively. Arecibo detections, marginals, and non-detections are respectively represented by black solid stars, open stars, and blue downward triangles. The low luminosity end (log(Lr) <9) shows a color dichotomy with Hi detections and non-detections clustering around g−i ~ 0.4 and g−i ~ 0.8 respectively, showing a clear distinction between the blue cloud and red sequence galaxies. Above luminosities of log(Lr) ~ 9.5, the blue cloud disappears while the red sequence galaxies shift to redder colors, g−i ~ 1.2.
Current usage metrics show cumulative count of Article Views (full-text article views including HTML views, PDF and ePub downloads, according to the available data) and Abstracts Views on Vision4Press platform.
Data correspond to usage on the plateform after 2015. The current usage metrics is available 48-96 hours after online publication and is updated daily on week days.
Initial download of the metrics may take a while.