Fig. A.1
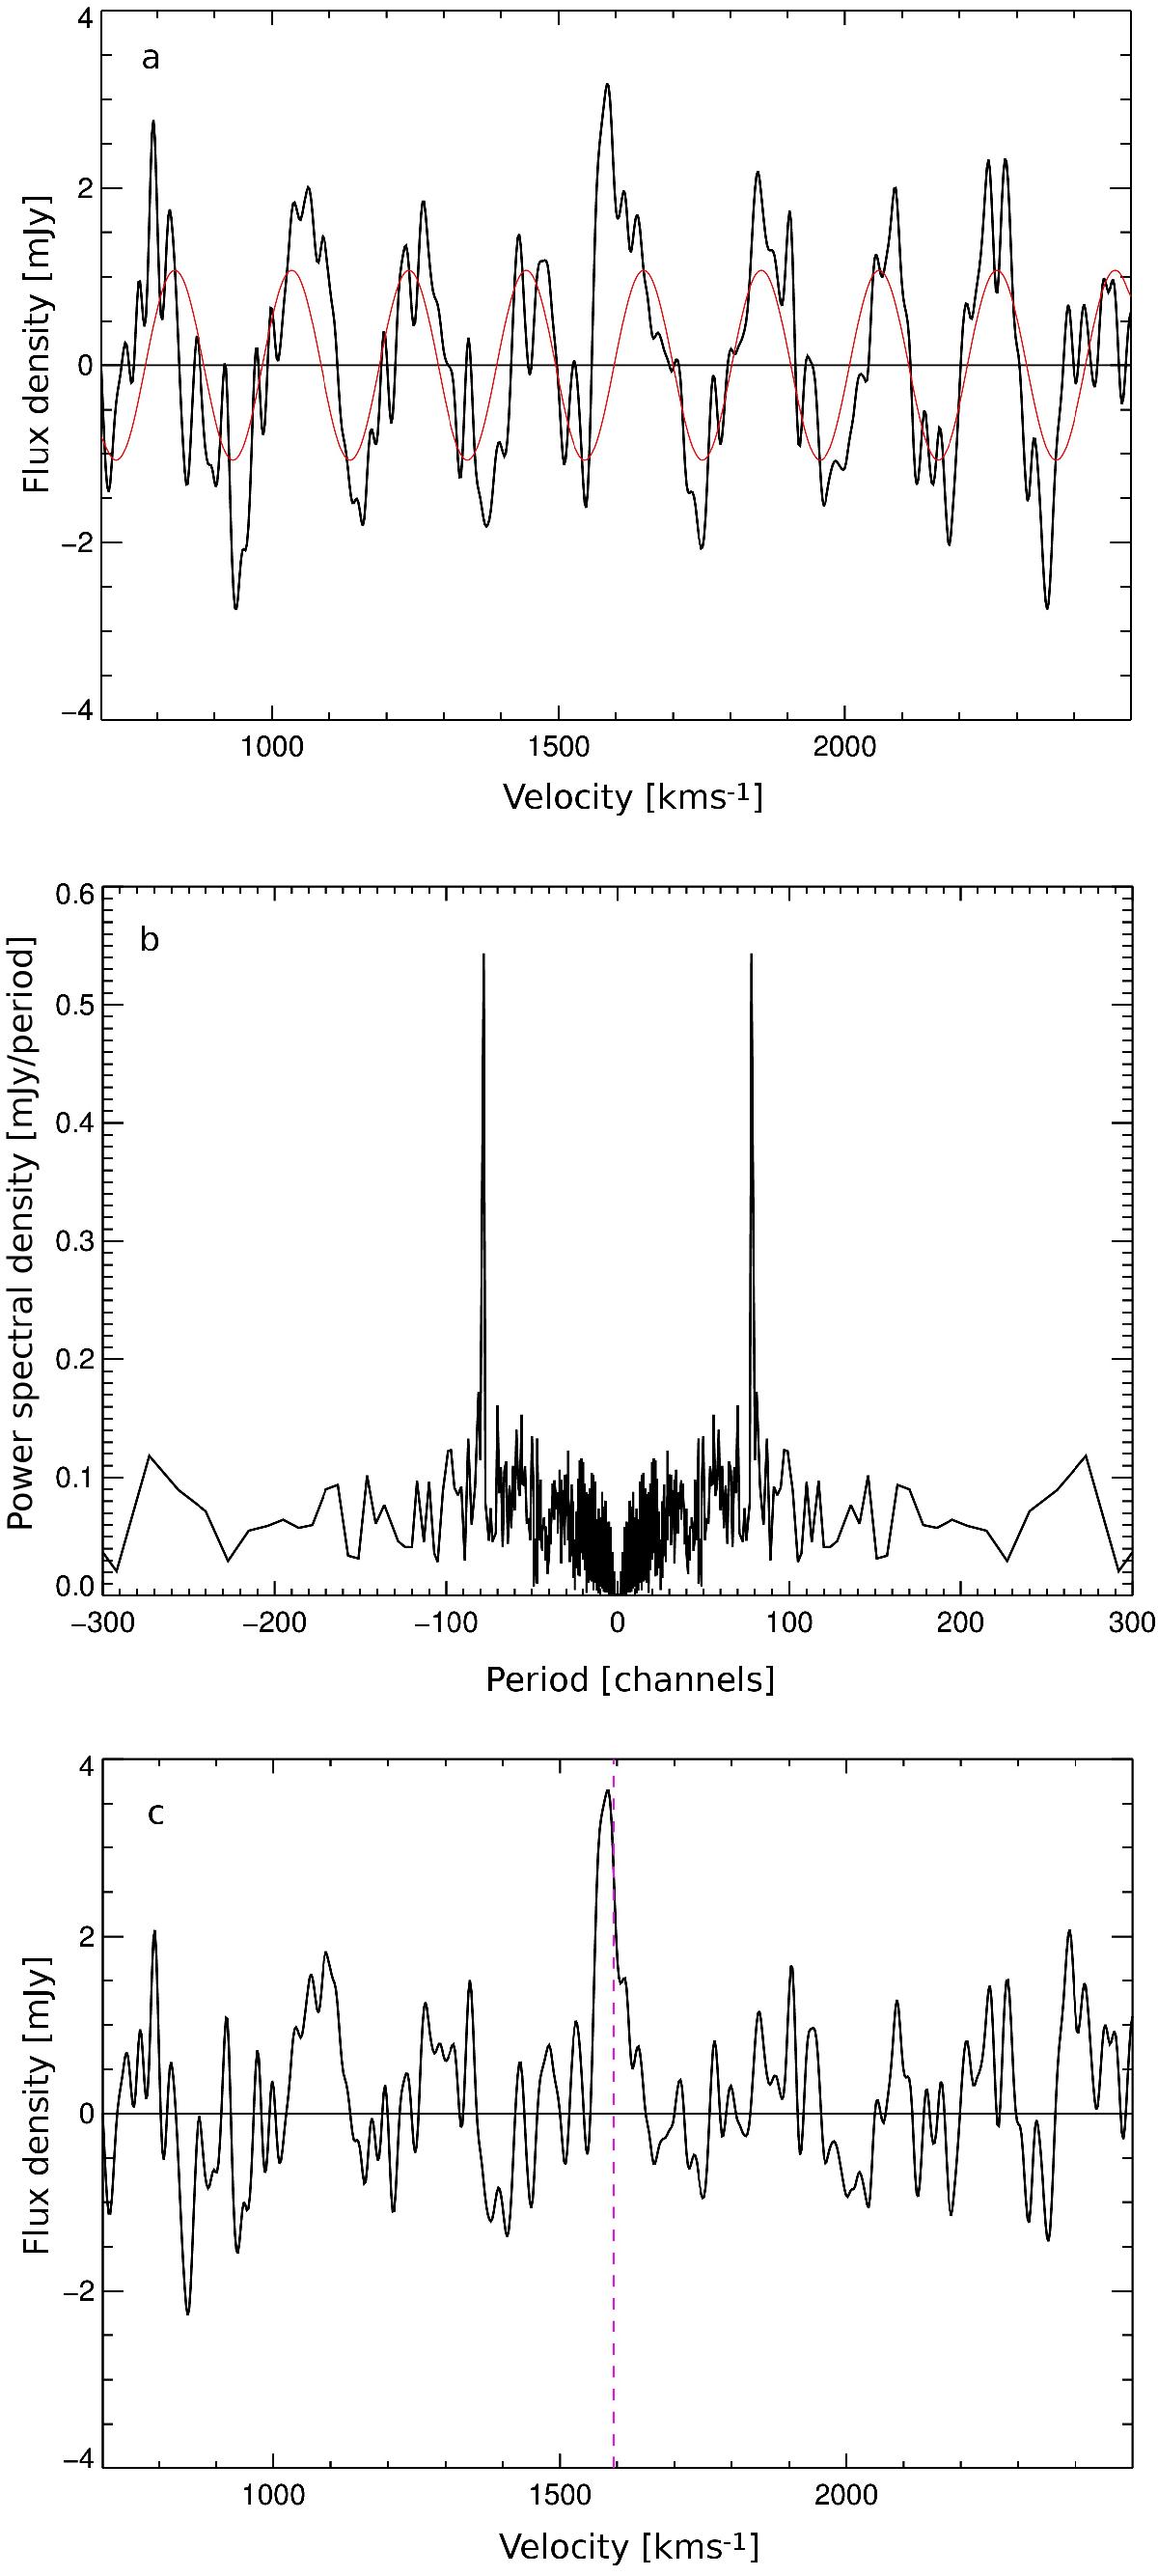
Illustration of the removal of a baseline ripple, in source 1260. a) Original observed Hi line spectrum, flux density (mJy) as a function of heliocentric velocity with the standing wave over-layed in red. b) Spectral power density (mJy/period) vs. period for the Fourier transform where the spikes in power density corresponding to 78 channels due to the baseline ripple are clearly much higher than the rest of the spectrum. c) The reverse Fourier transform of b) with the 78 channel period peaks removed. The standing wave has clearly been eliminated from the spectrum and the source signal is now easily identified. The vertical magenta dashed line indicates the SDSS optical velocity. This illustration represents one of two cases in our sample where this procedure was used. Source 1260 contained the stronger of the two standing waves.
Current usage metrics show cumulative count of Article Views (full-text article views including HTML views, PDF and ePub downloads, according to the available data) and Abstracts Views on Vision4Press platform.
Data correspond to usage on the plateform after 2015. The current usage metrics is available 48-96 hours after online publication and is updated daily on week days.
Initial download of the metrics may take a while.