Fig. 6
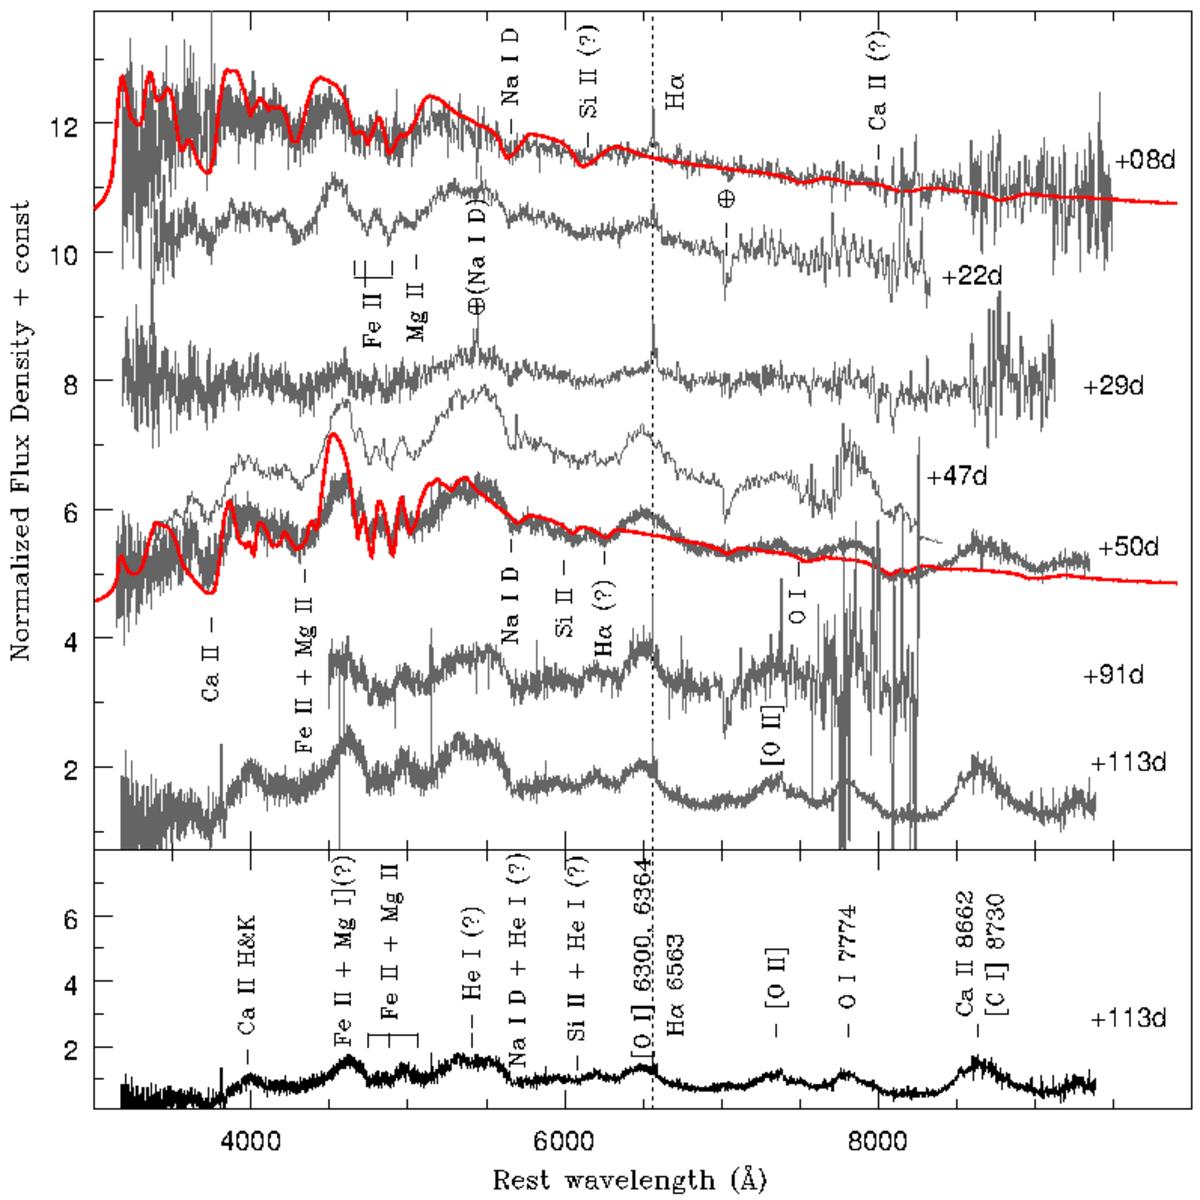
Spectral evolution of SN 2012aa. All spectra were normalized to the average continuum flux density measured in the line-free region 6700−7000 Å and additive offsets were applied for clarity. The dotted vertical line shows the position of Hα. Phases are with respect to the date of maximum V-band light. The spectra obtained on +8 d and +51 d were modelled using SYNOW (red curves) to identify the important line features.
Current usage metrics show cumulative count of Article Views (full-text article views including HTML views, PDF and ePub downloads, according to the available data) and Abstracts Views on Vision4Press platform.
Data correspond to usage on the plateform after 2015. The current usage metrics is available 48-96 hours after online publication and is updated daily on week days.
Initial download of the metrics may take a while.