Fig. 4
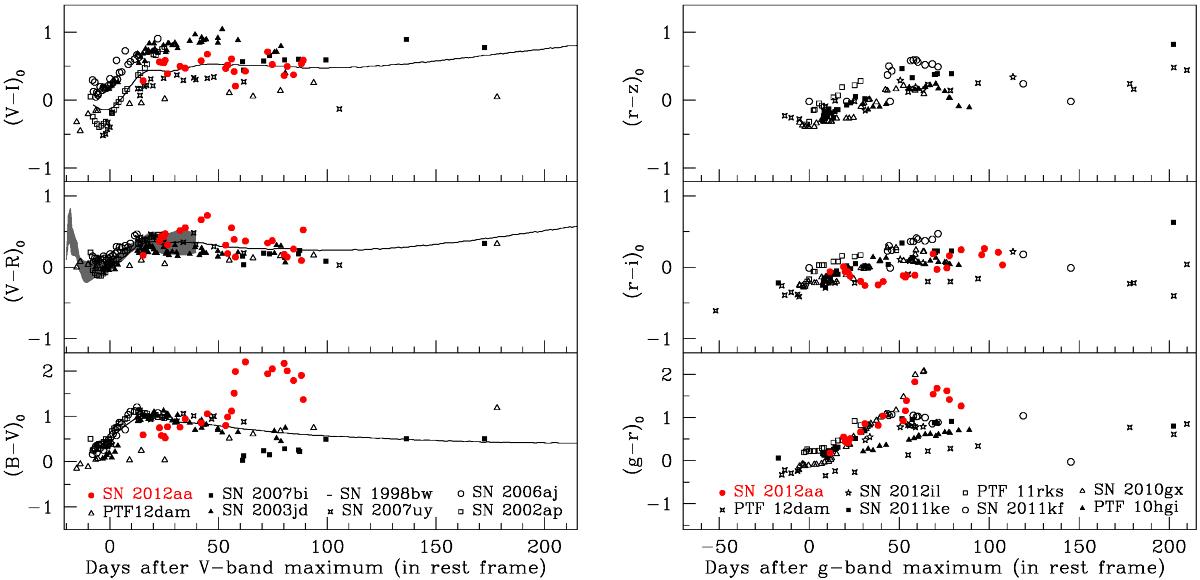
Colour evolution of SN 2012aa and comparison with other events. All of the colours have been corrected for reddening. Left panel: four broad-lined SNe Ic (SNe 1998bw Clocchiatti et al. 2011; 2002ap, Foley et al. 2003; 2003jd Valenti et al. 2008a; and 2006aj Ferrero et al. 2006), along with the normal SN Ibc SN 2007uy (Roy et al. 2013) and two SLSNe Ic (SN 2007bi Young et al. 2010 and PTF12dam Nicholl et al. 2013) are compared with the colour evolution of SN 2012aa. The shaded region in the central panel ((V−R)0 colour) represents the colour evolution of SNe Ibc as discussed by Drout et al. (2011). Unlike normal and broad-lined SNe Ibc, SN 2012aa and SLSNe show evolution on longer timescales. Right panel: comparison with SLSNe (SNe 2012il, 2011ke, 2011kf, PTF 11hgi, and 11rks from Inserra et al. 2013; PTF 12dam from Nicholl et al. 2013; and SN 2010gx from Pastorello et al. 2010b). After maximum brightness, the colour of SNe Ibc appears to evolve quickly, whereas in SLSNe it evolves more slowly, becoming redder over a longer time. The sudden increment in the (B−V)0 (or (g−r)0) colour of SN 2012aa after +50 d is similar to the colour variation observed in SN 2010gx.
Current usage metrics show cumulative count of Article Views (full-text article views including HTML views, PDF and ePub downloads, according to the available data) and Abstracts Views on Vision4Press platform.
Data correspond to usage on the plateform after 2015. The current usage metrics is available 48-96 hours after online publication and is updated daily on week days.
Initial download of the metrics may take a while.