Fig. 15
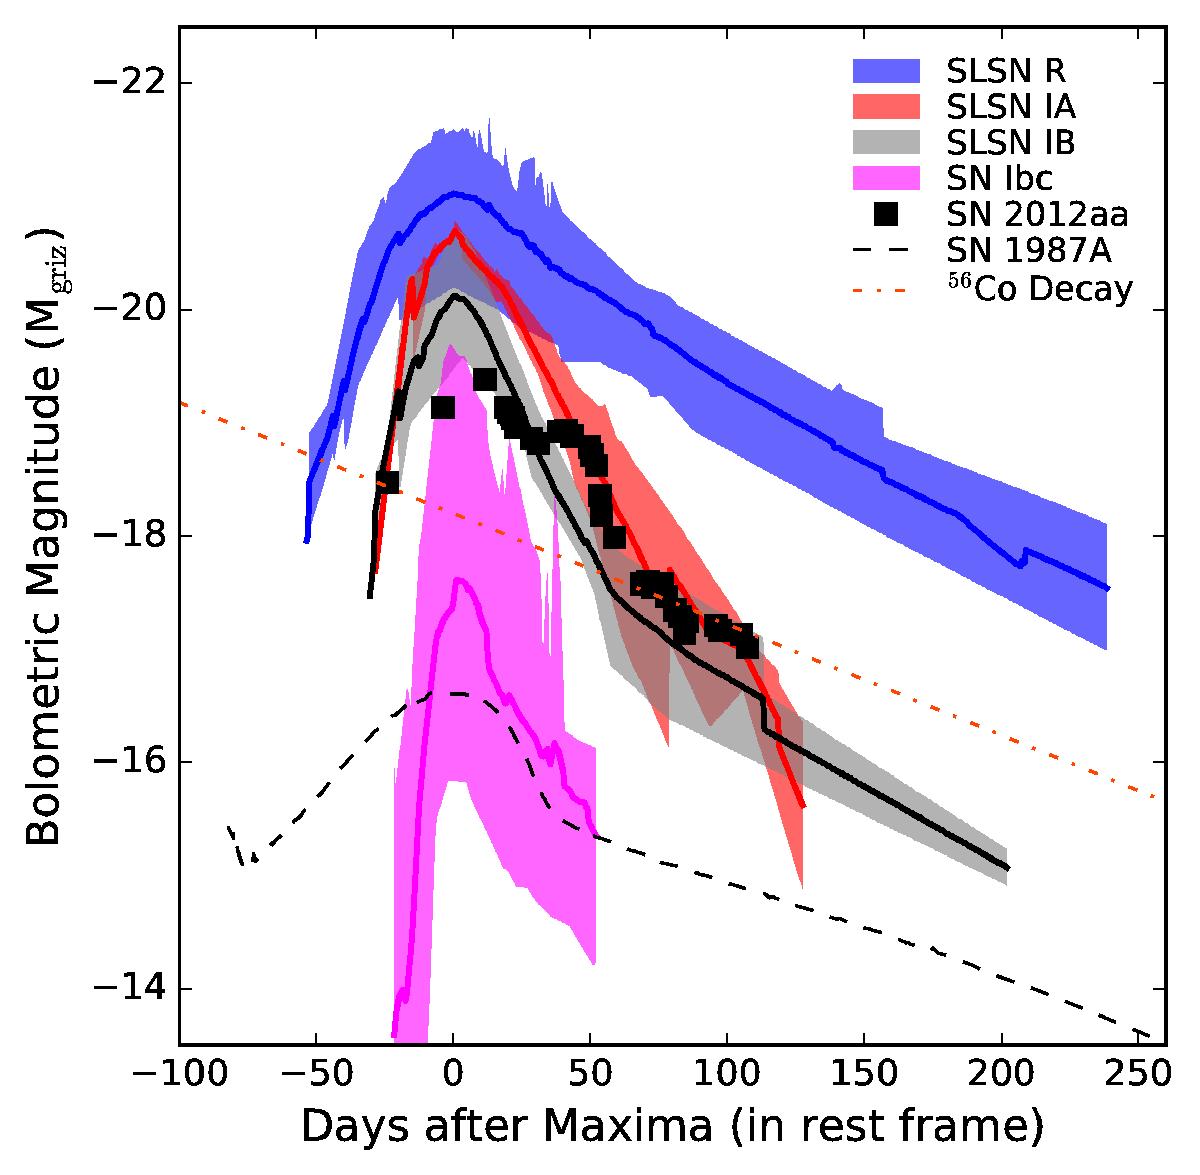
Comparison of the SN 2012aa quasi-bolometric light curve with those of SLSNe Ic and SNe Ibc. The SLSN datasets are obtained from Inserra et al. (2013) and Nicholl et al. (2015), while the SN Ibc datasets are from Taddia et al. (2015). SLSN-R are distinctly different from SLSN-I. There may be two categories (A and B) of SLSN-I. The solid lines represent the mean of each population. The plot also presents the decay rate of 56Co and the well-observed Type II SN 1987A, which had a nebular decline consistent with 56Co decay.
Current usage metrics show cumulative count of Article Views (full-text article views including HTML views, PDF and ePub downloads, according to the available data) and Abstracts Views on Vision4Press platform.
Data correspond to usage on the plateform after 2015. The current usage metrics is available 48-96 hours after online publication and is updated daily on week days.
Initial download of the metrics may take a while.