Fig. 10
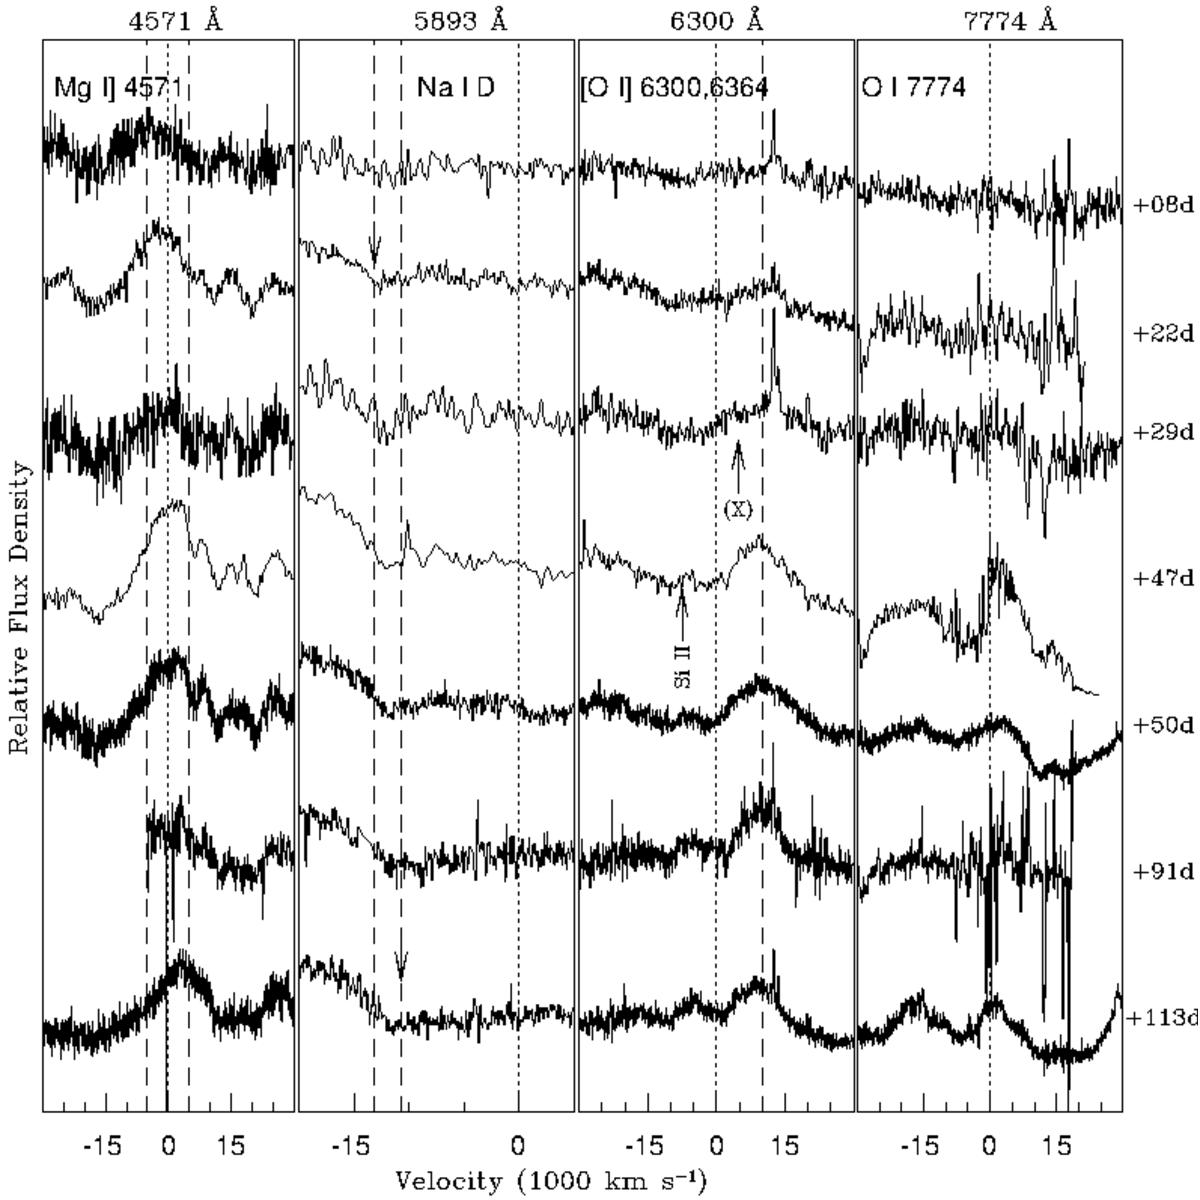
Temporal evolution of some spectral windows in SN 2012aa. The zero velocity shown with a dotted line in each panel marks the rest wavelength of the corresponding element mentioned at the top of the panels. The flux density scale is relative. The flux of each line has been scaled in the same way as for the entire spectra mentioned in Fig. 6. The dashed lines are the boundaries between which the emission peaks and absorption dips get shifted during the SN evolution. The downward arrows in the second panel show the blueshift of theNa i D absorption. The arrow marked with “X” shows the emergence of [O i ] by +29 d.
Current usage metrics show cumulative count of Article Views (full-text article views including HTML views, PDF and ePub downloads, according to the available data) and Abstracts Views on Vision4Press platform.
Data correspond to usage on the plateform after 2015. The current usage metrics is available 48-96 hours after online publication and is updated daily on week days.
Initial download of the metrics may take a while.