Fig. 8
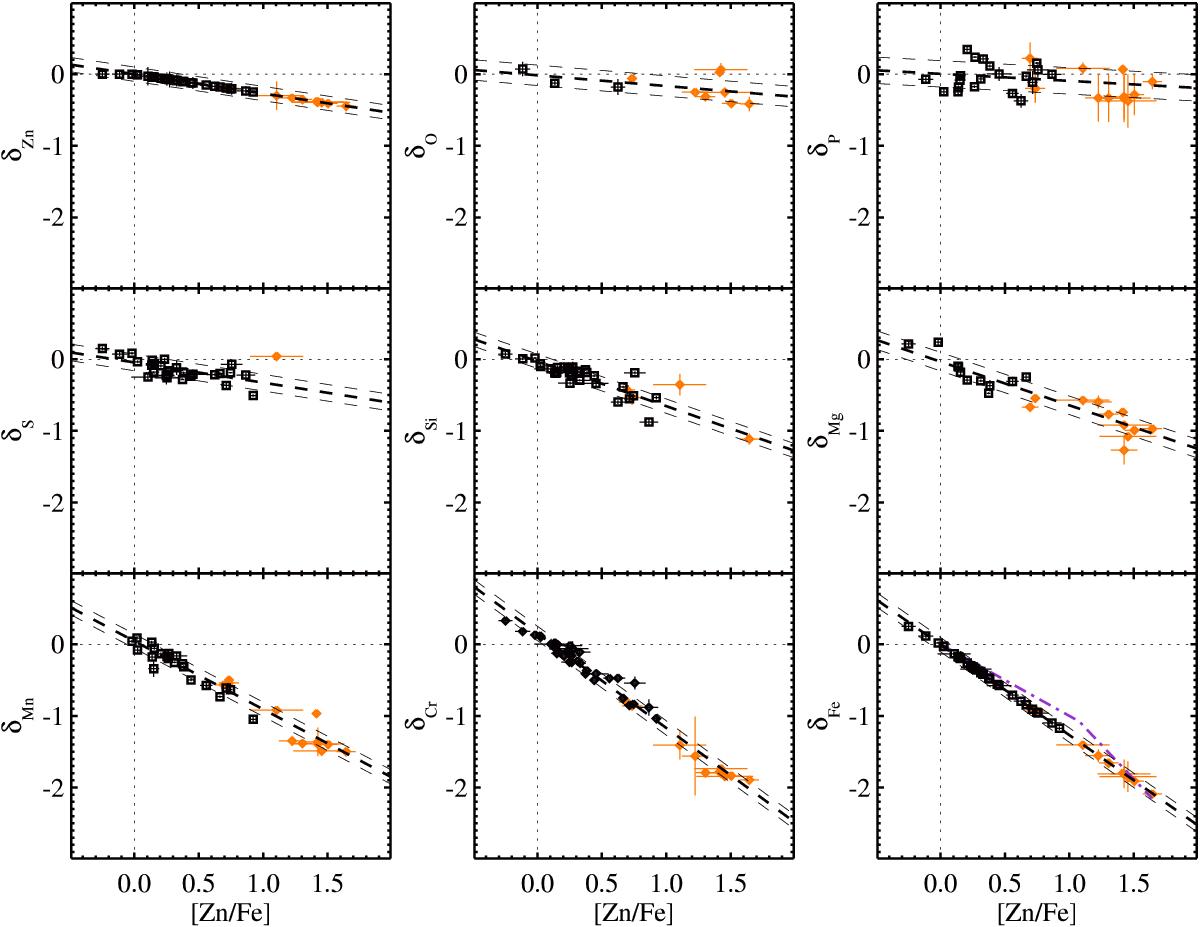
Distribution of the depletion δX with [Zn/Fe] (depletion sequences), derived from the observed [X/Zn] (see Sect. 3.1). The black squares are for DLAs and the orange diamonds are for the Galactic lines of sight. The distributions of Zn and Fe depletion are shown here for clarity. They have no scatter by construction. The dash-dotted curve shows what the depletion of Fe would have been if we had assumed the expected [Zn/H] trend with [Zn/Fe] based on Eq. (10) of Jenkins (2009); see Fig. 5. This is shown only for Fe, as an example.
Current usage metrics show cumulative count of Article Views (full-text article views including HTML views, PDF and ePub downloads, according to the available data) and Abstracts Views on Vision4Press platform.
Data correspond to usage on the plateform after 2015. The current usage metrics is available 48-96 hours after online publication and is updated daily on week days.
Initial download of the metrics may take a while.