Fig. 7
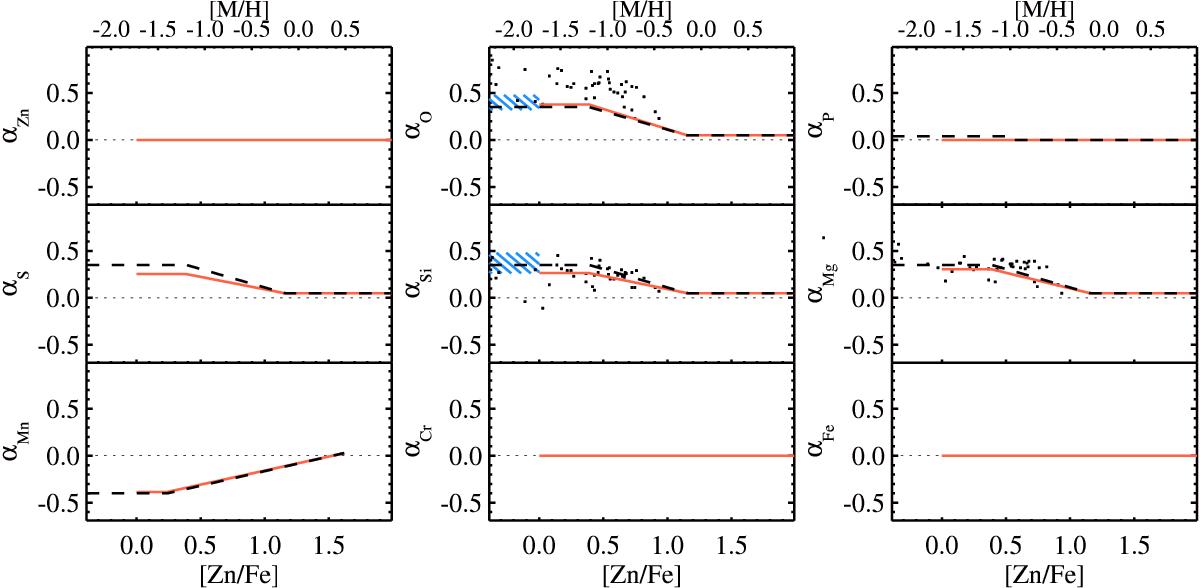
Assumed nucleosynthetic over- or underabundances (red solid curves), in units of [Zn/Fe]. The values of αX,0 (at [Zn/Fe] = 0) are adopted from the observed intercepts of the sequences of relative abundances (αO,0 = 0.38 ± 0.10, αP,0 = 0.00 ± 0.06, αS,0 = 0.25 ± 0.03, αSi,0 = 0.26 ± 0.03, αMg,0 = 0.30 ± 0.04, and αMn,0 = −0.39 ± 0.03). The shape of the curves are adopted from Galactic observations in the literature, from Lambert (1987) and McWilliam (1997) for α elements (dashed black curves), from Wheeler et al. (1989), Mishenina et al. (2015), and Battistini & Bensby (2015) for Mn, and from Caffau et al. (2016) and Roederer et al. (2014) for P. These are presented in units of stellar metallicity [M/H], where the scaling to ISM [Zn/Fe] units assumes a linear relation of the data shown in Fig. 6. This is only a scale conversion that allows us to use the nucleosynthetic over- or underabundances in the literature, and should not be used as a one-to-one conversion between [Zn/Fe] and [M/H]. The shaded region corresponds to the α-element enhancement measured by Becker et al. (2012) for metal-poor DLAs (within 1σ of the mean), while the small dots are derived from Jonsell et al. (2005) for metal-poor stars (see Appendix C).
Current usage metrics show cumulative count of Article Views (full-text article views including HTML views, PDF and ePub downloads, according to the available data) and Abstracts Views on Vision4Press platform.
Data correspond to usage on the plateform after 2015. The current usage metrics is available 48-96 hours after online publication and is updated daily on week days.
Initial download of the metrics may take a while.