Fig. 3
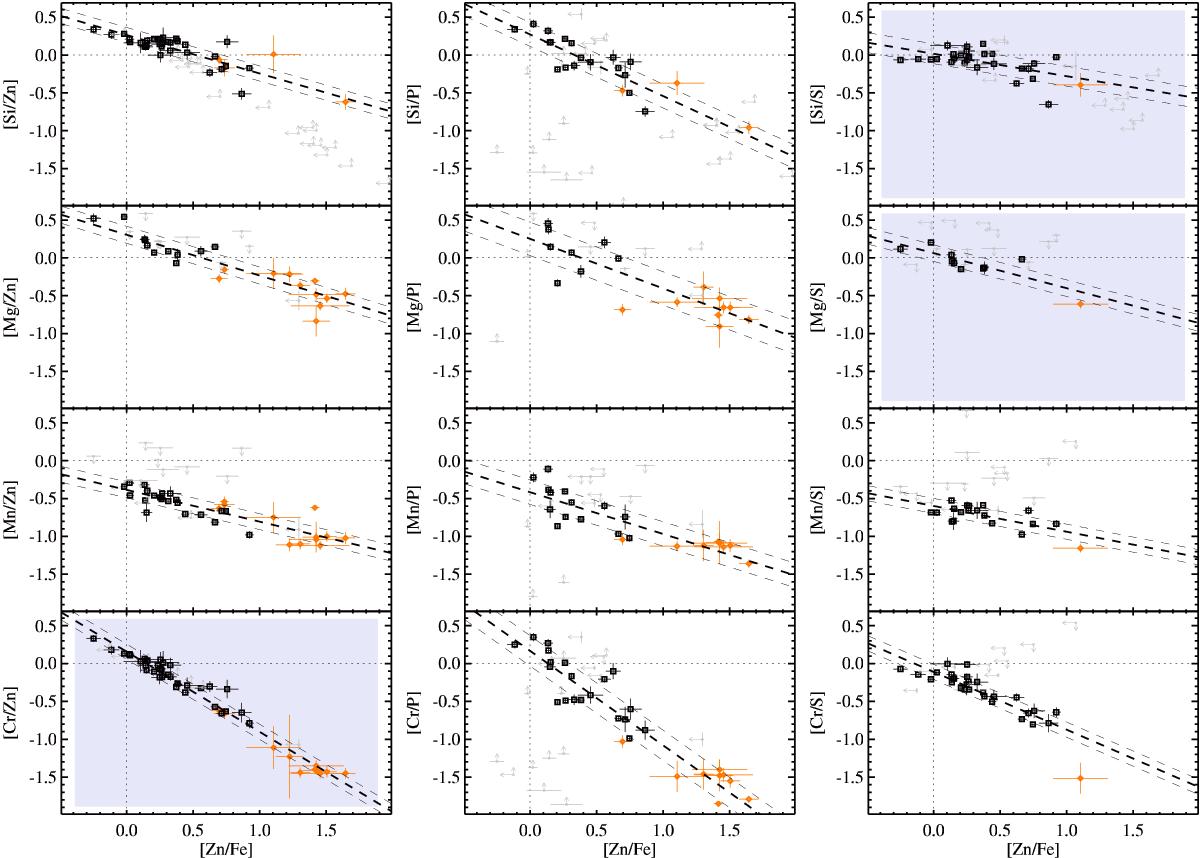
Relative abundances of an element X with respect to Zn (left column), P (central), and S (right), against the [Zn/Fe]. The black squares are for DLAs and the orange diamonds are for the Galactic lines of sight. The abundances are summed among individual velocity components; see Table F.2. The dashed curves show the linear fit to the data and the intrinsic scatter σint. The sequences become steeper for elements that are more strongly depleted in dust grains. The panels with shaded areas show relative abundances of elements that share similar nucleosynthetic history.
Current usage metrics show cumulative count of Article Views (full-text article views including HTML views, PDF and ePub downloads, according to the available data) and Abstracts Views on Vision4Press platform.
Data correspond to usage on the plateform after 2015. The current usage metrics is available 48-96 hours after online publication and is updated daily on week days.
Initial download of the metrics may take a while.