Free Access
Fig. 8
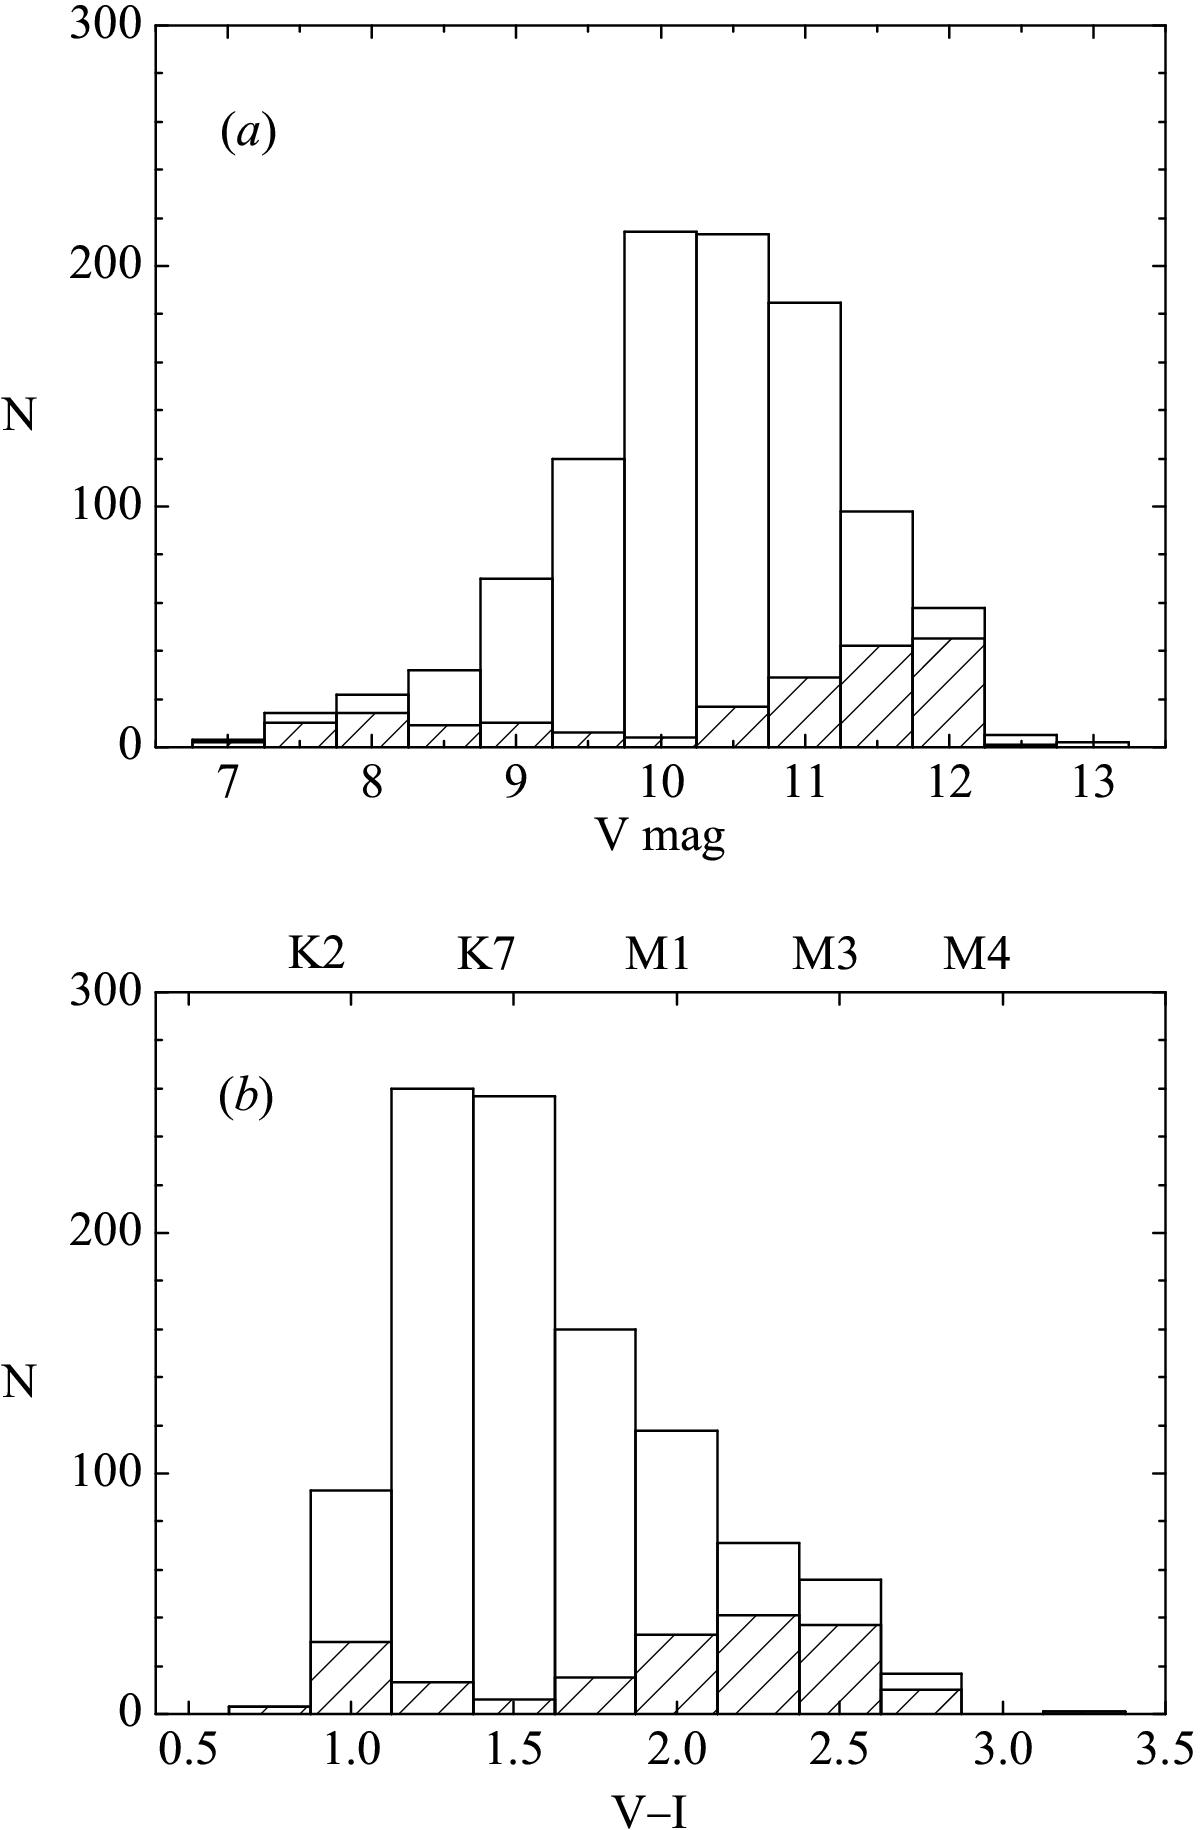
Distributions of observed stars in magnitude V (panel a)) and color-index V−I (panel b)). Spectral types shown at the top of panel b) are in accordance with the calibration of V−I by Bessell & Brett (1988). The unshaded area denotes a sample of observed MCC stars and the hatched zone is for observed CNS stars.
This figure is made of several images, please see below:
Current usage metrics show cumulative count of Article Views (full-text article views including HTML views, PDF and ePub downloads, according to the available data) and Abstracts Views on Vision4Press platform.
Data correspond to usage on the plateform after 2015. The current usage metrics is available 48-96 hours after online publication and is updated daily on week days.
Initial download of the metrics may take a while.