Fig. 3
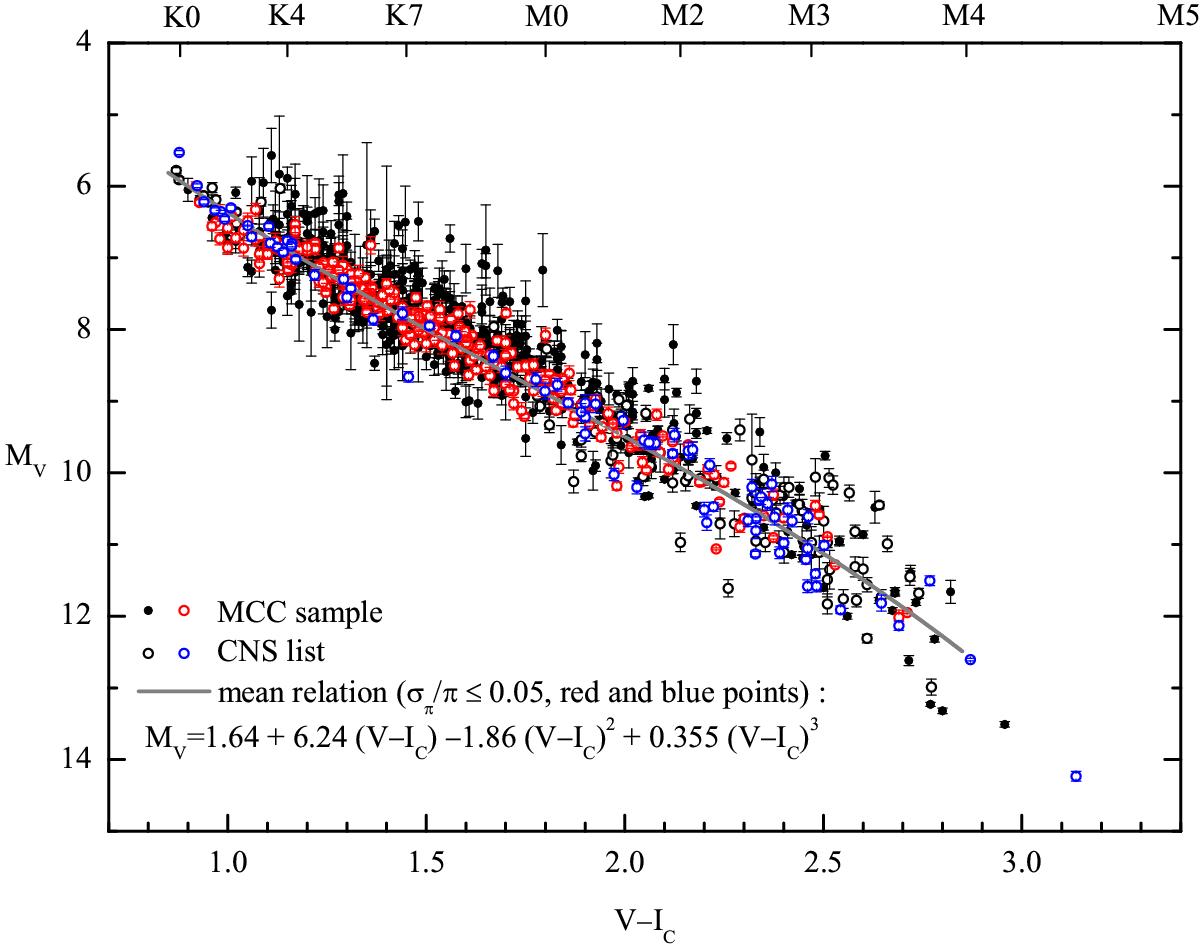
(MV,V−IC) diagram for the MCC stars (black solid and red circles) and stars from the CNS list (black open and blue circles). The thick line is the mean relation for the color interval 0.9 <V−IC< 2.8, defined by Bartašiūtė et al. (2012) using the present sample stars with σπ/π ≤ 0.05 (red and blue circles). The error bars represent uncertainties due to trigonometric parallax error. Spectral types shown on the top axis are in accordance with the calibration of V−IC by Bessell & Brett (1988).
Current usage metrics show cumulative count of Article Views (full-text article views including HTML views, PDF and ePub downloads, according to the available data) and Abstracts Views on Vision4Press platform.
Data correspond to usage on the plateform after 2015. The current usage metrics is available 48-96 hours after online publication and is updated daily on week days.
Initial download of the metrics may take a while.