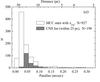
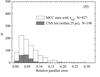
Fig. 2
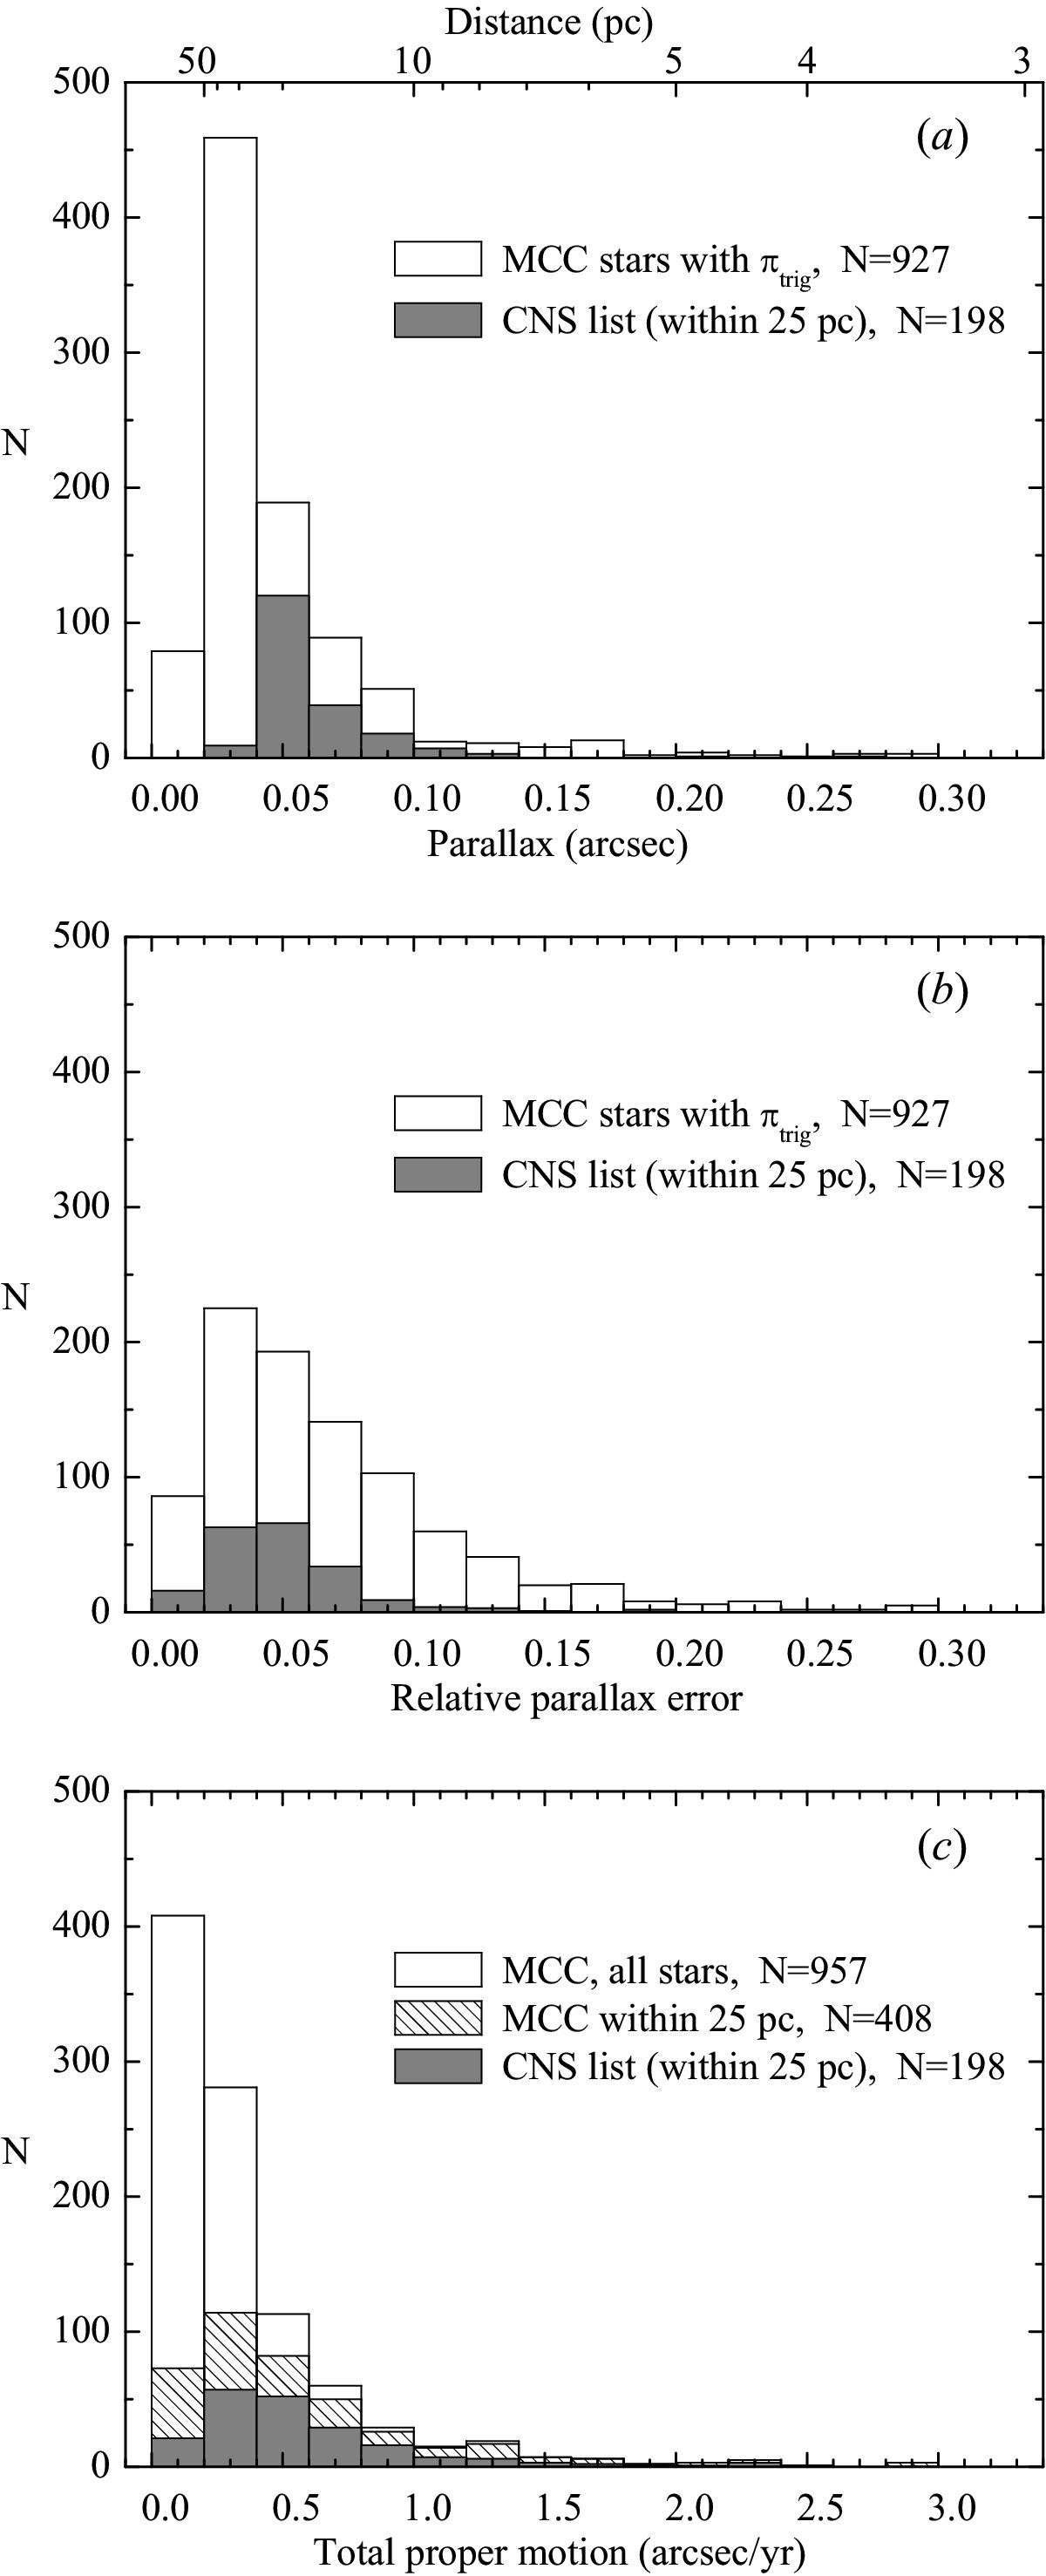
Distributions of radial-velocity program stars by values of trigonometric parallax a); its relative error b); and proper motion c). In panel a), the top axis shows distances in pc; the two nearest (d< 3 pc) MCC stars are outside the plotting area. To enable a direct comparison of the two different samples in panel c), a separate histogram (hatched) is shown for a subset of MCC stars within 25 pc.
Current usage metrics show cumulative count of Article Views (full-text article views including HTML views, PDF and ePub downloads, according to the available data) and Abstracts Views on Vision4Press platform.
Data correspond to usage on the plateform after 2015. The current usage metrics is available 48-96 hours after online publication and is updated daily on week days.
Initial download of the metrics may take a while.