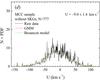
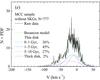
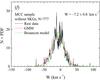
Fig. 18
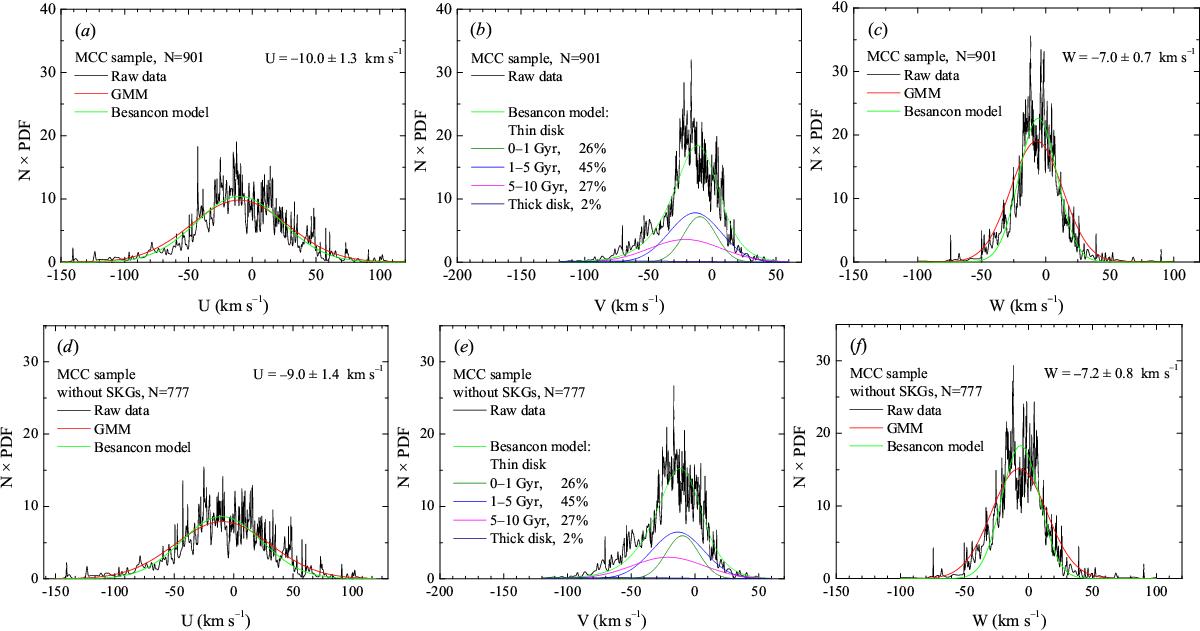
Distributions of heliocentric space-velocity components U, V, and W for K–M dwarfs in the MCC sample. The mean values of U and W and their errors, indicated in the panels, are from the GMM (red line). For V (panels b) and e)), the Gaussian curves of the Besançon model simulations are shown for different age groups and for the entire population. The percentages indicated are relative numbers of model stars in different age groups.
Current usage metrics show cumulative count of Article Views (full-text article views including HTML views, PDF and ePub downloads, according to the available data) and Abstracts Views on Vision4Press platform.
Data correspond to usage on the plateform after 2015. The current usage metrics is available 48-96 hours after online publication and is updated daily on week days.
Initial download of the metrics may take a while.