Fig. 16
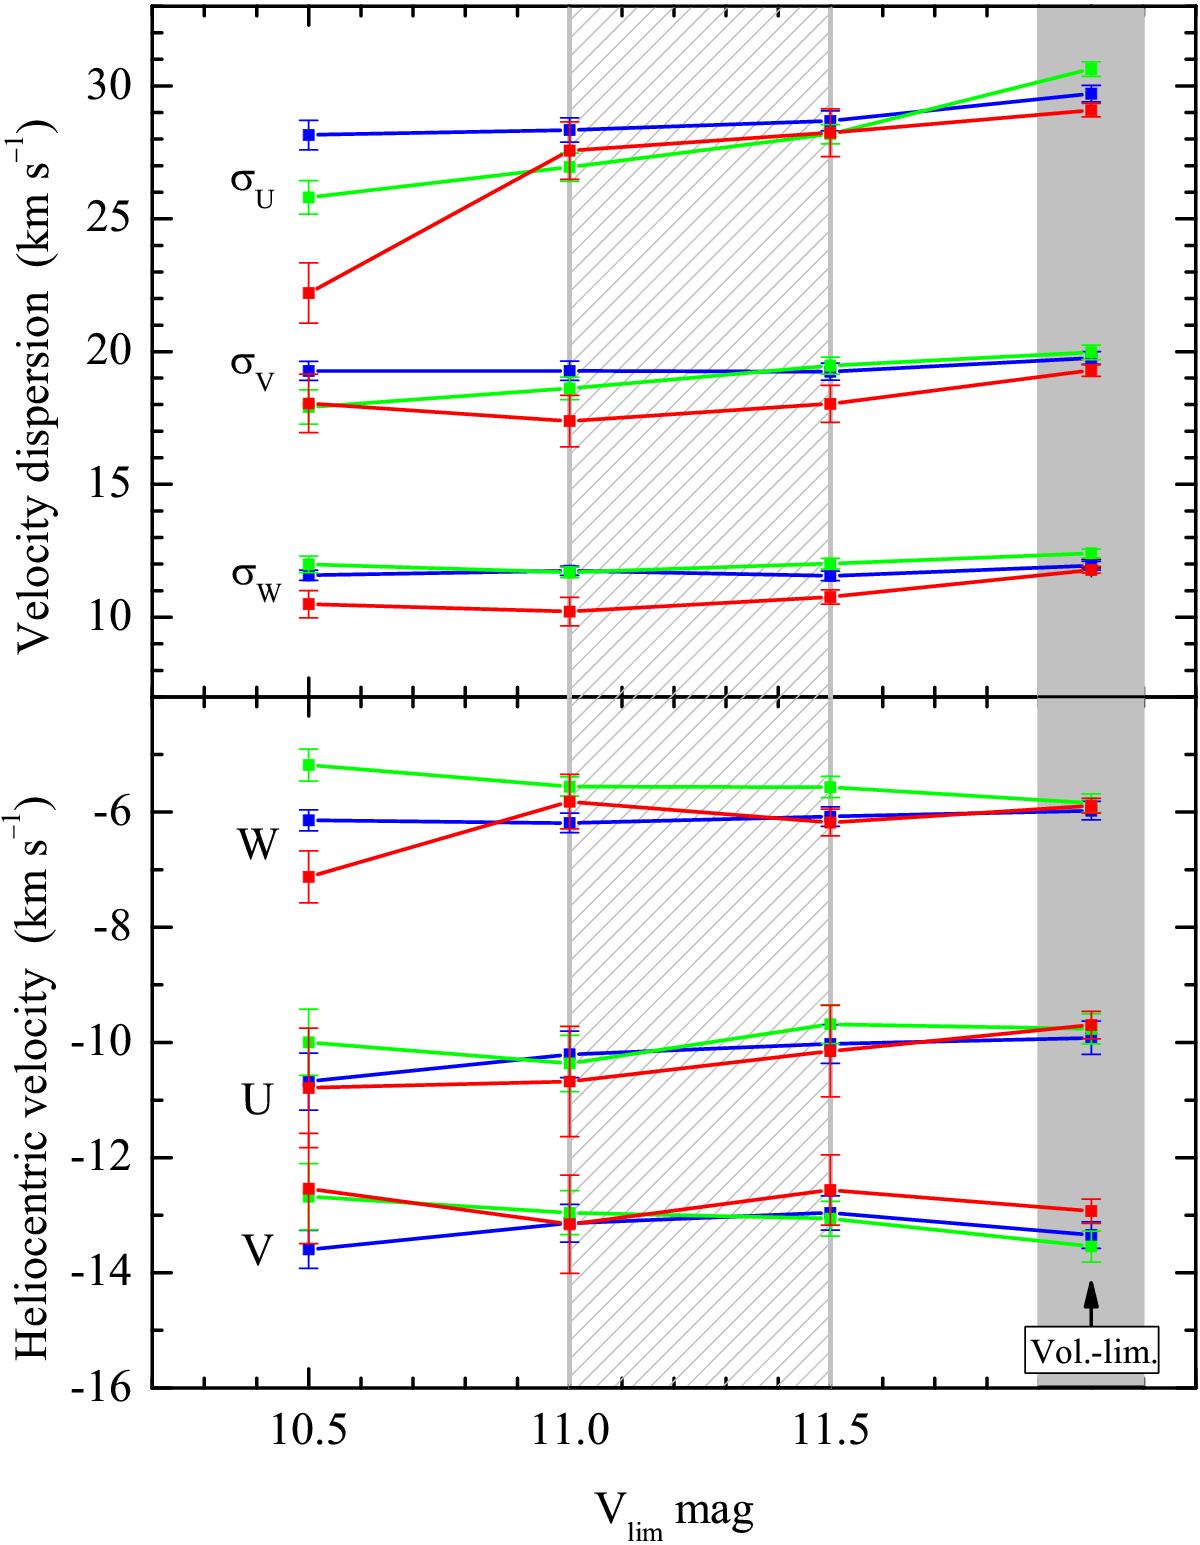
Comparison of space velocities U,V,W and their dispersions in the simulated samples of K0–M5 dwarfs with different limiting magnitudes. The colored lines represent diferent spectral intervals: K0–K4 (blue), K5–K9 (green), and M0–M5 (red). The filled points within the gray vertical stripe indicate the values for volume-limited sample (d = 140 pc). The hatched zone shows an approximate magnitude limit of the MCC sample.
Current usage metrics show cumulative count of Article Views (full-text article views including HTML views, PDF and ePub downloads, according to the available data) and Abstracts Views on Vision4Press platform.
Data correspond to usage on the plateform after 2015. The current usage metrics is available 48-96 hours after online publication and is updated daily on week days.
Initial download of the metrics may take a while.