Fig. 15
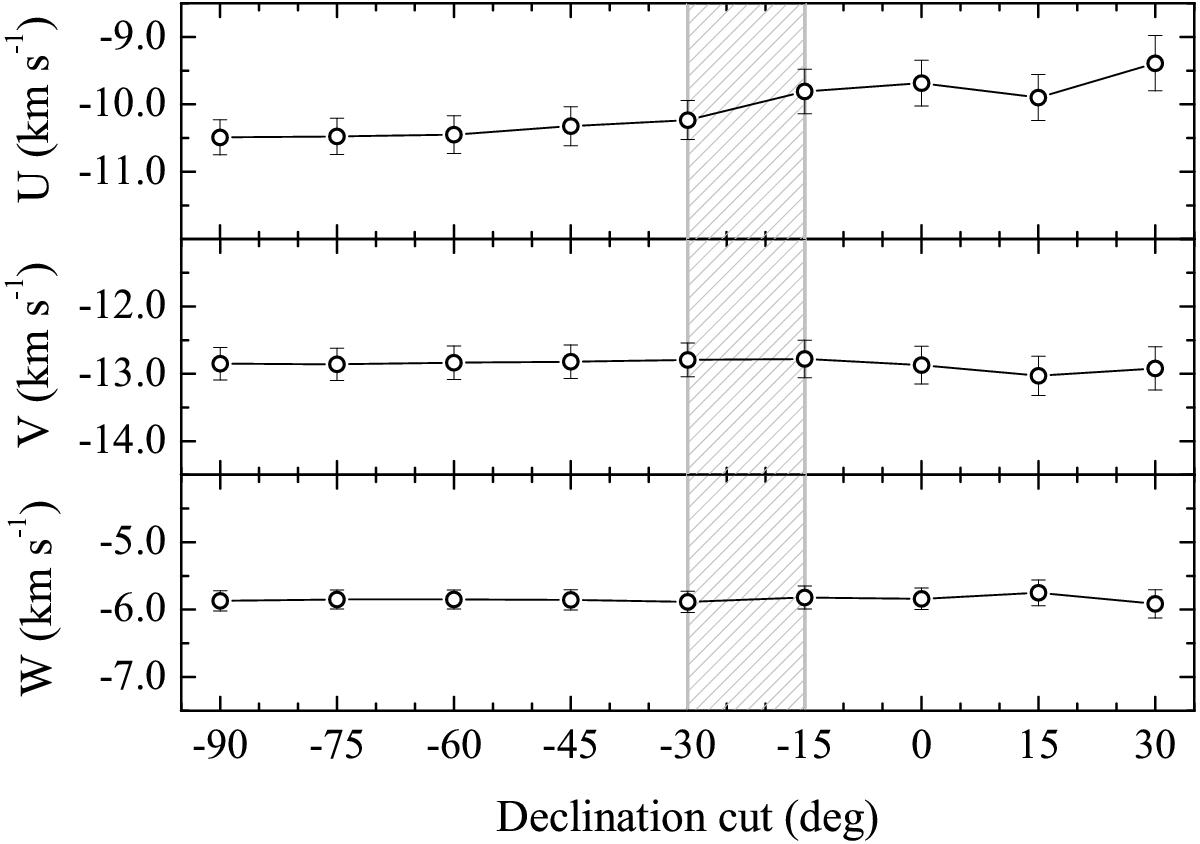
Comparison of the distributions of space velocities U,V,W of K0–M5 dwarfs in the simulated datasets with different declination cuts. Data are based on the Besançon model. The hatched area shows the declination zone between −30°, an observational limit of the MCC sample, and −15°, where a decline in completeness of the sample starts to take place.
Current usage metrics show cumulative count of Article Views (full-text article views including HTML views, PDF and ePub downloads, according to the available data) and Abstracts Views on Vision4Press platform.
Data correspond to usage on the plateform after 2015. The current usage metrics is available 48-96 hours after online publication and is updated daily on week days.
Initial download of the metrics may take a while.