Fig. 13
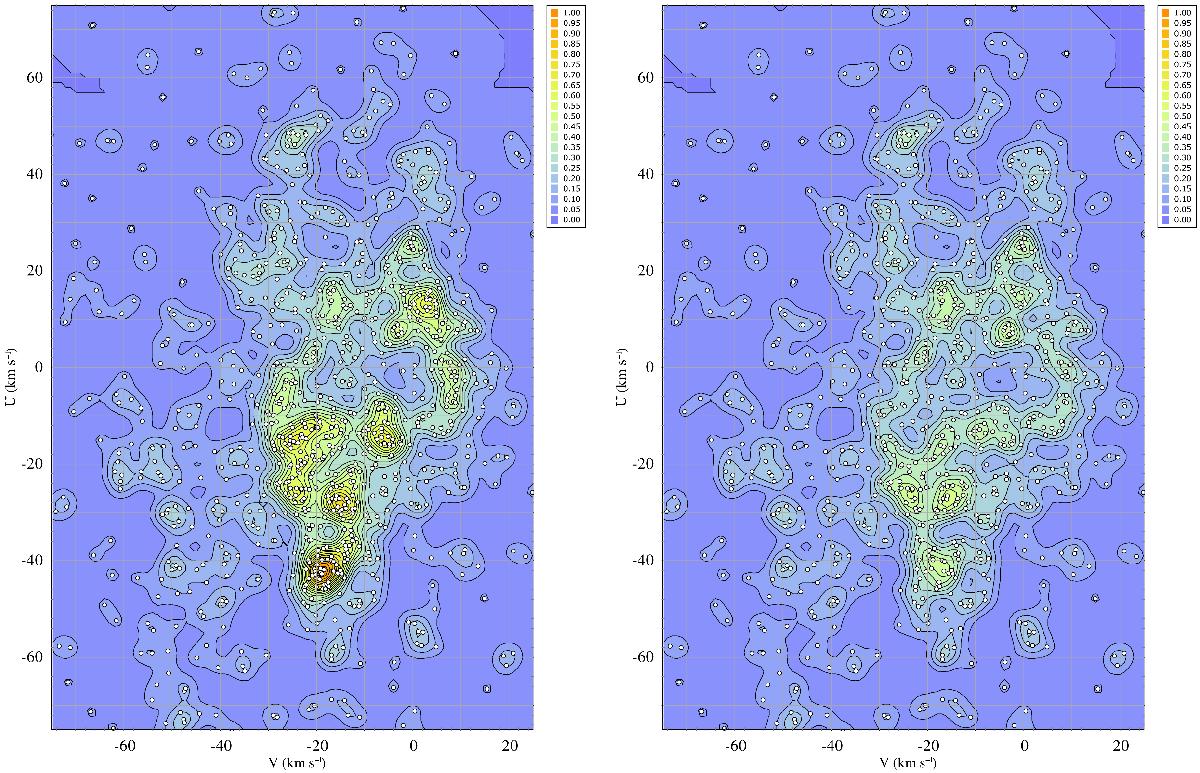
Velocity structures of K–M dwarfs in the Bottlinger diagram, delineated using Gaussian smoothing with a standard deviation of 0.5 km s-1. Left-hand and right-hand panels show the distributions before and after removal of candidate members of SKGs (Table 7), respectively. The contour levels correspond to color scale numbers which indicate fractional overdensities normalized to a unit maximum associated with the heaviest concentration (the Hyades MG) in the left-hand diagram. Small dots denote the actual positions of K–M dwarfs with σπ/π< 0.30.
Current usage metrics show cumulative count of Article Views (full-text article views including HTML views, PDF and ePub downloads, according to the available data) and Abstracts Views on Vision4Press platform.
Data correspond to usage on the plateform after 2015. The current usage metrics is available 48-96 hours after online publication and is updated daily on week days.
Initial download of the metrics may take a while.