Fig. 7
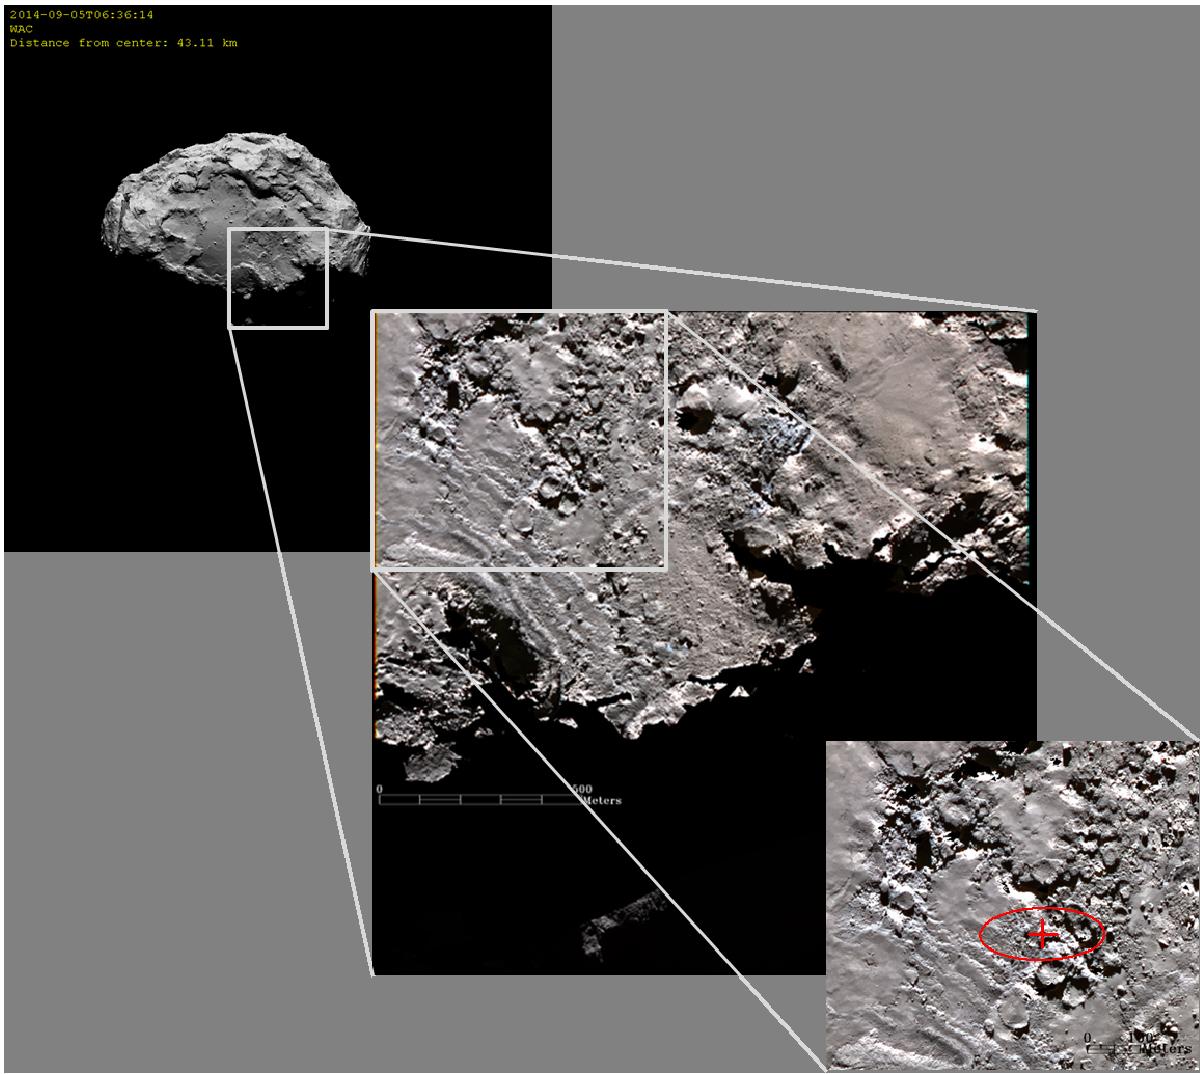
Simulated WAC view of the image taken on 5 September 2014 around 06:36:14 UTC (months before the outburst) with the NAC FOV marked in gray square (top panel), NAC image in RGB (middle panel) with the source region in RGB (bottom panel). R: IR, G: Hydra, B: Green. The best estimate of the jet source point is marked by the red cross and the ellipse provides the 2σ uncertainty of the source location.
Current usage metrics show cumulative count of Article Views (full-text article views including HTML views, PDF and ePub downloads, according to the available data) and Abstracts Views on Vision4Press platform.
Data correspond to usage on the plateform after 2015. The current usage metrics is available 48-96 hours after online publication and is updated daily on week days.
Initial download of the metrics may take a while.