Fig. 4
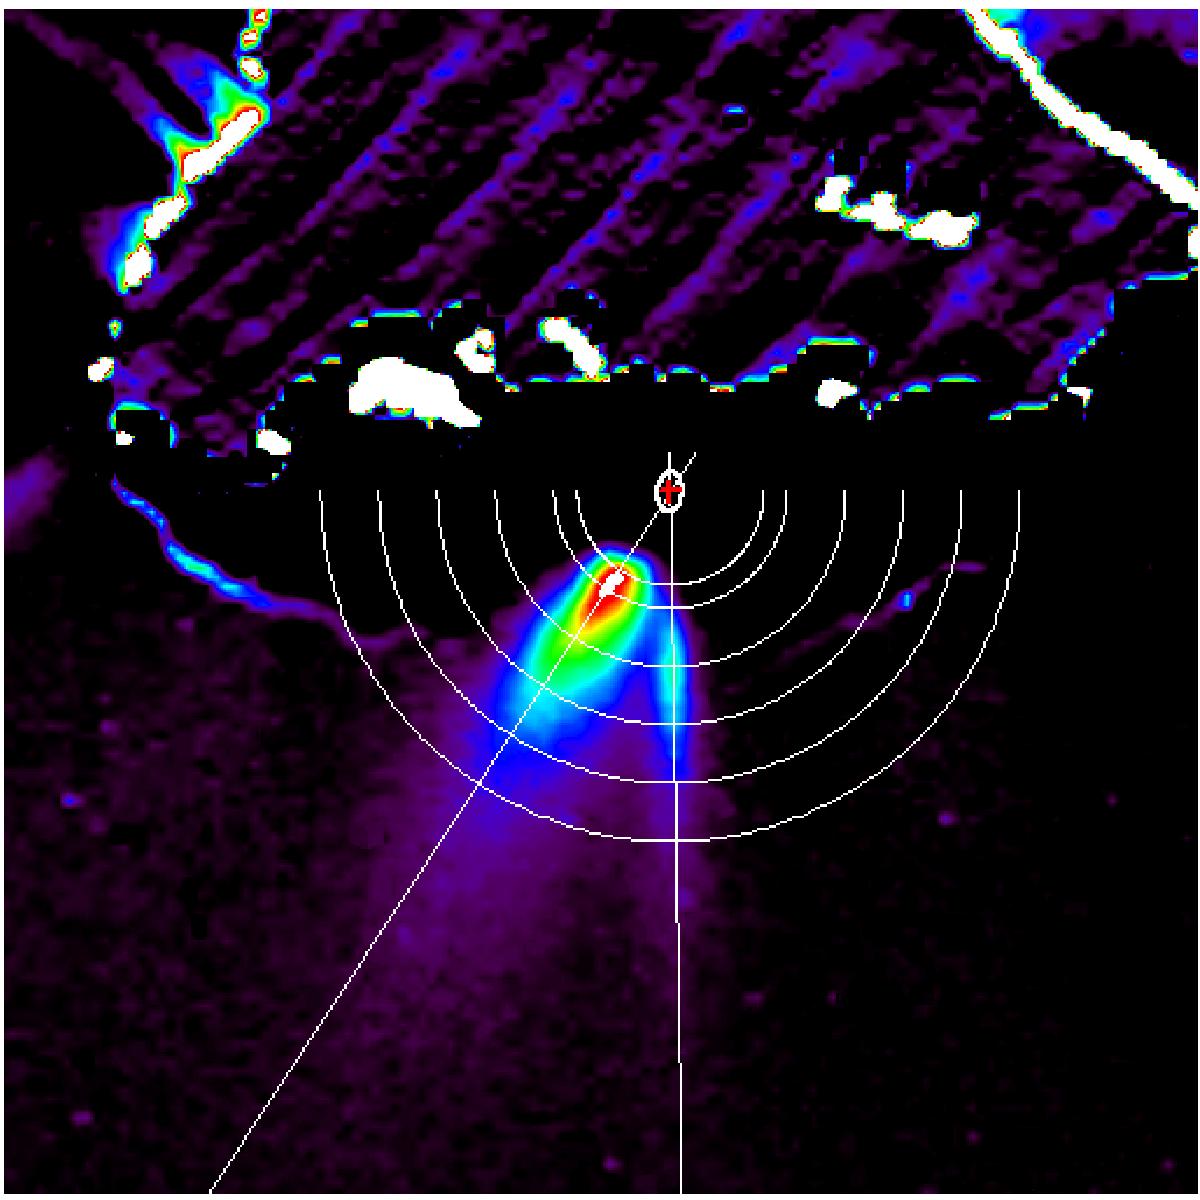
Difference image between the exposures taken at 7:11:20 (before the outburst) and 7:16:09 (after the outburst) in the UV-375 nm filter clearly showing the broad main jet and a secondary narrow filament. The red cross shows the suspected source point constructed under the assumption that the two jets originate from the same location and the ellipse gives the 2σ uncertainty. The half circles indicate the distances used for the angular radiance distributions plotted in Fig. 5.
Current usage metrics show cumulative count of Article Views (full-text article views including HTML views, PDF and ePub downloads, according to the available data) and Abstracts Views on Vision4Press platform.
Data correspond to usage on the plateform after 2015. The current usage metrics is available 48-96 hours after online publication and is updated daily on week days.
Initial download of the metrics may take a while.