Fig. 2
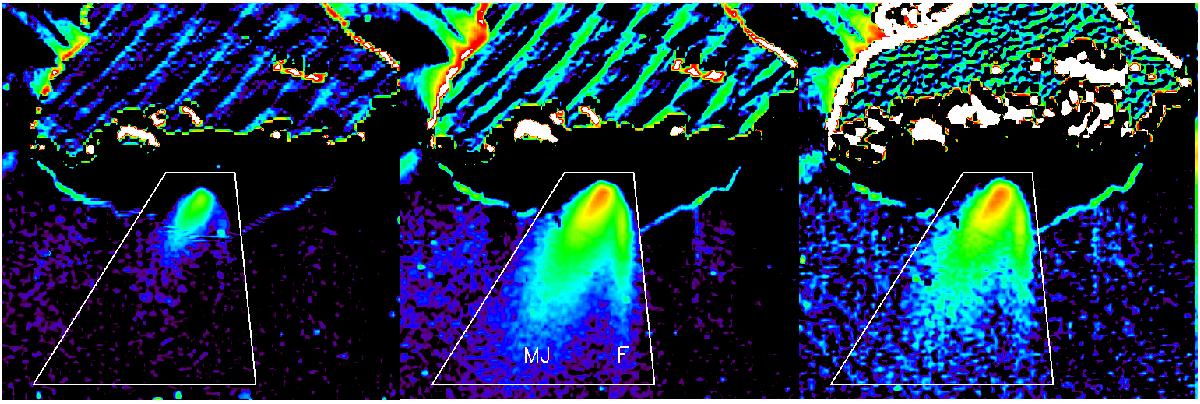
Co-registered, cleaned and magnified (factor 4) difference images. The image taken before the outburst (left panel in Fig. 1) has been subtracted from the three continuum images acquired after the outburst started (panels 2−4 in Fig. 1). The polygonal area is defined as the jet region used to evaluate the brightness evolution of the outburst. MJ indicates the main jet, F stands for filament.
Current usage metrics show cumulative count of Article Views (full-text article views including HTML views, PDF and ePub downloads, according to the available data) and Abstracts Views on Vision4Press platform.
Data correspond to usage on the plateform after 2015. The current usage metrics is available 48-96 hours after online publication and is updated daily on week days.
Initial download of the metrics may take a while.