Fig. 13
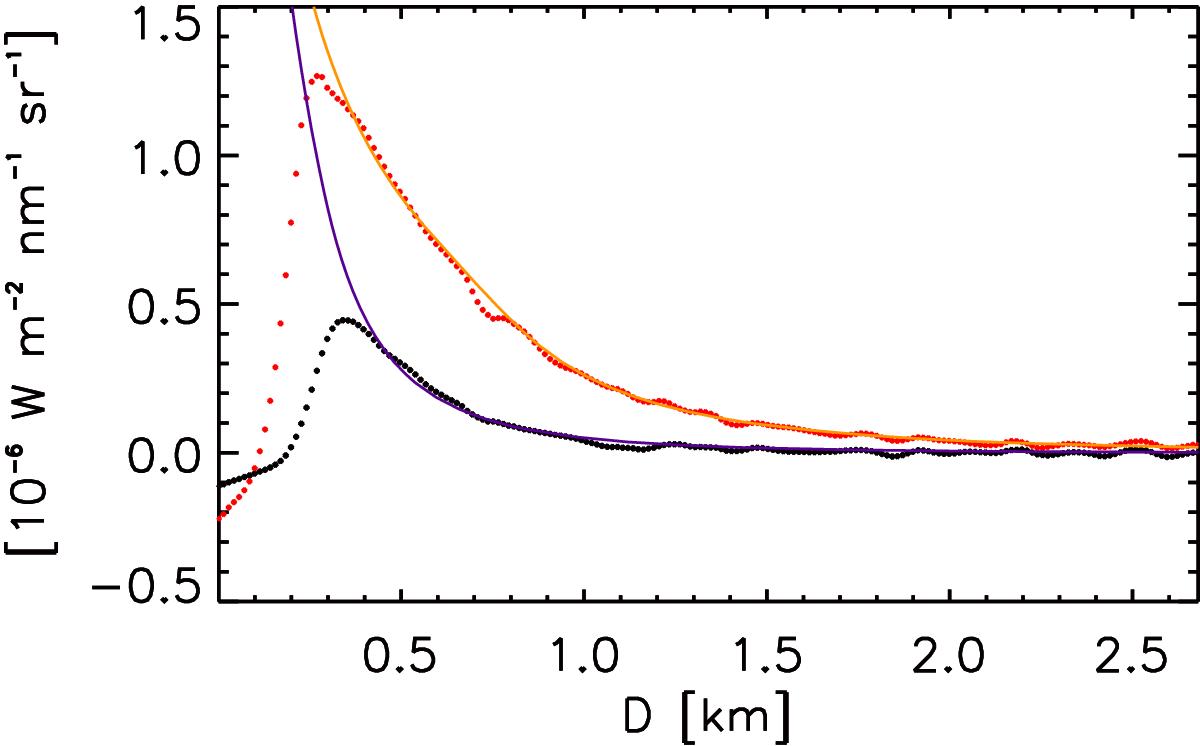
Model fits of radiance distribution along the jet axis (orange and blue lines) with the data (red and black dots) for the first two (UV-375 nm) difference images. Fit parameters are the size distribution exponent, the dust production rate, and the start time of the outburst. The best fit shown was achieved for an exponent of g = 2.6 and a start time of t = −75 s (zero time defined as start of exposure of first image).
Current usage metrics show cumulative count of Article Views (full-text article views including HTML views, PDF and ePub downloads, according to the available data) and Abstracts Views on Vision4Press platform.
Data correspond to usage on the plateform after 2015. The current usage metrics is available 48-96 hours after online publication and is updated daily on week days.
Initial download of the metrics may take a while.