Fig. 12
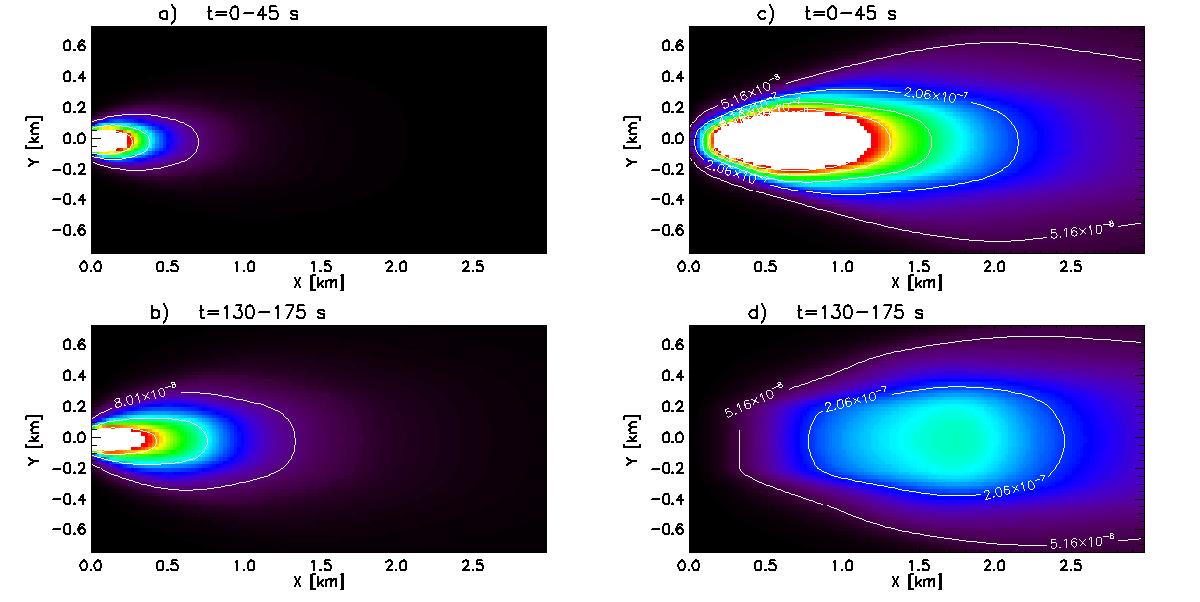
Simulated images integrated between t = 0−45 s and t = 130−175 s (to simulate the long exposures of the UV-375 nm images) for two different source functions. In the left panels a) and b) the production rate is kept constant during the whole simulation, on the right (c) and d)) the production was stopped at t = 5 s. In this case the moving dust cloud has detached from the source at t = 130−175 s and a rather flat brightness distribution can be seen.
Current usage metrics show cumulative count of Article Views (full-text article views including HTML views, PDF and ePub downloads, according to the available data) and Abstracts Views on Vision4Press platform.
Data correspond to usage on the plateform after 2015. The current usage metrics is available 48-96 hours after online publication and is updated daily on week days.
Initial download of the metrics may take a while.