Fig. 10
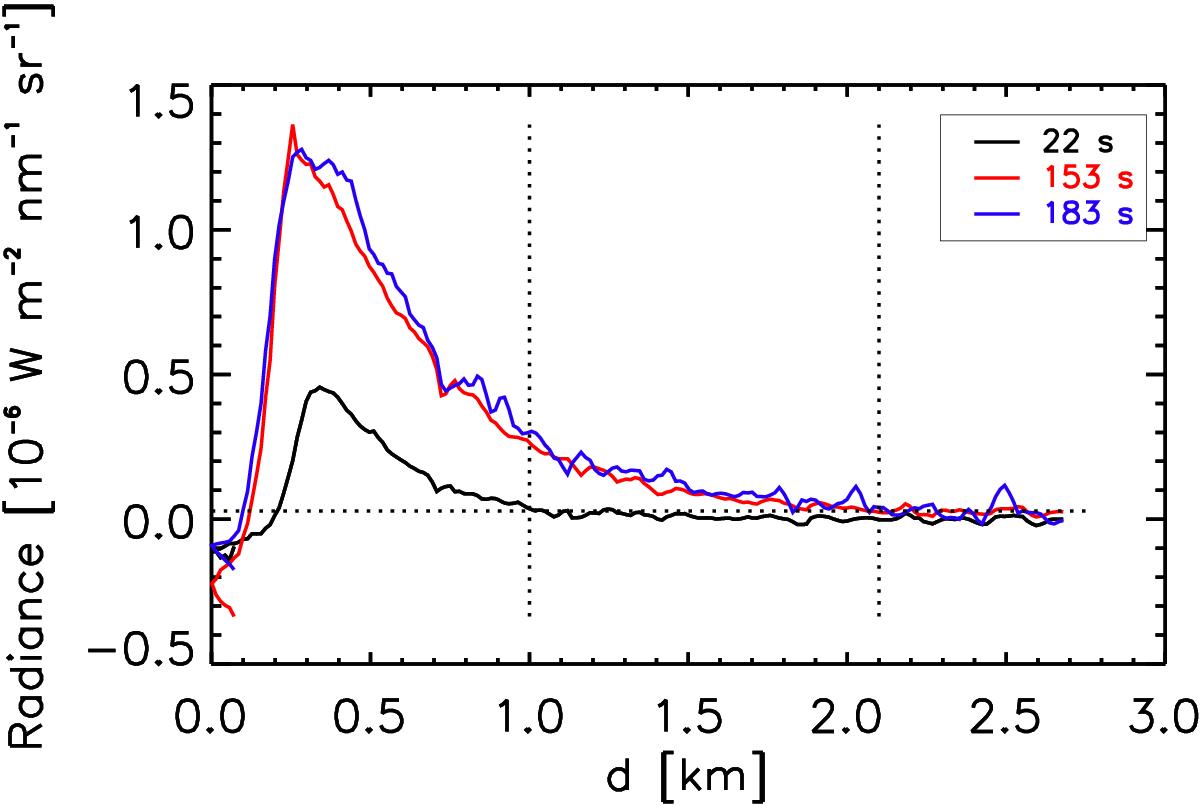
Radial radiance profiles on the axis of the main jet. The horizontal line indicates the uncertainty level in the background subtraction and the vertical dotted lines indicate the minimum travel distance of dust for the first two exposures. For the 3rd image the much higher noise level is too high for useful analysis. Note that for the 3rd image (blue) acquired in VIS-610nm filter the brightness has been multiplied by p375*f375/p610*f610 to make the data comparable in terms of the dust cross section.
Current usage metrics show cumulative count of Article Views (full-text article views including HTML views, PDF and ePub downloads, according to the available data) and Abstracts Views on Vision4Press platform.
Data correspond to usage on the plateform after 2015. The current usage metrics is available 48-96 hours after online publication and is updated daily on week days.
Initial download of the metrics may take a while.