Fig. B.1
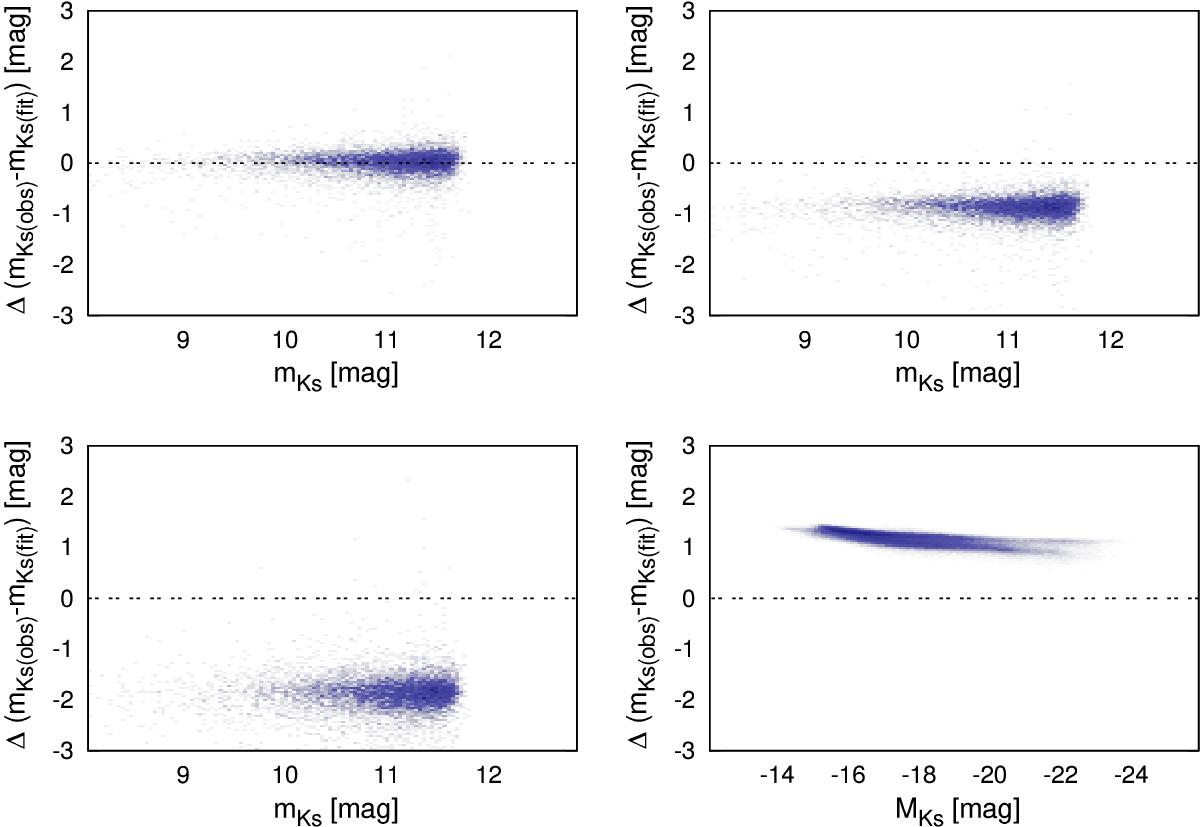
Comparison of the correlations between SDSS and 2MASS magnitudes. Top-left panel: our fit on observational data. Top-right panel: correlation from Bilir et al. (2008) as the straight dashed line, which has a clear off-set from our observational data. Bottom-left panel: performance of the relation derived from the one used in the Millennium simulation, which also deviates clearly from our observational data. Bottom-right panel: correlation from Bilir et al. (2008) applied on the Millennium simulation data, which does not fit either.
Current usage metrics show cumulative count of Article Views (full-text article views including HTML views, PDF and ePub downloads, according to the available data) and Abstracts Views on Vision4Press platform.
Data correspond to usage on the plateform after 2015. The current usage metrics is available 48-96 hours after online publication and is updated daily on week days.
Initial download of the metrics may take a while.