Fig. 3
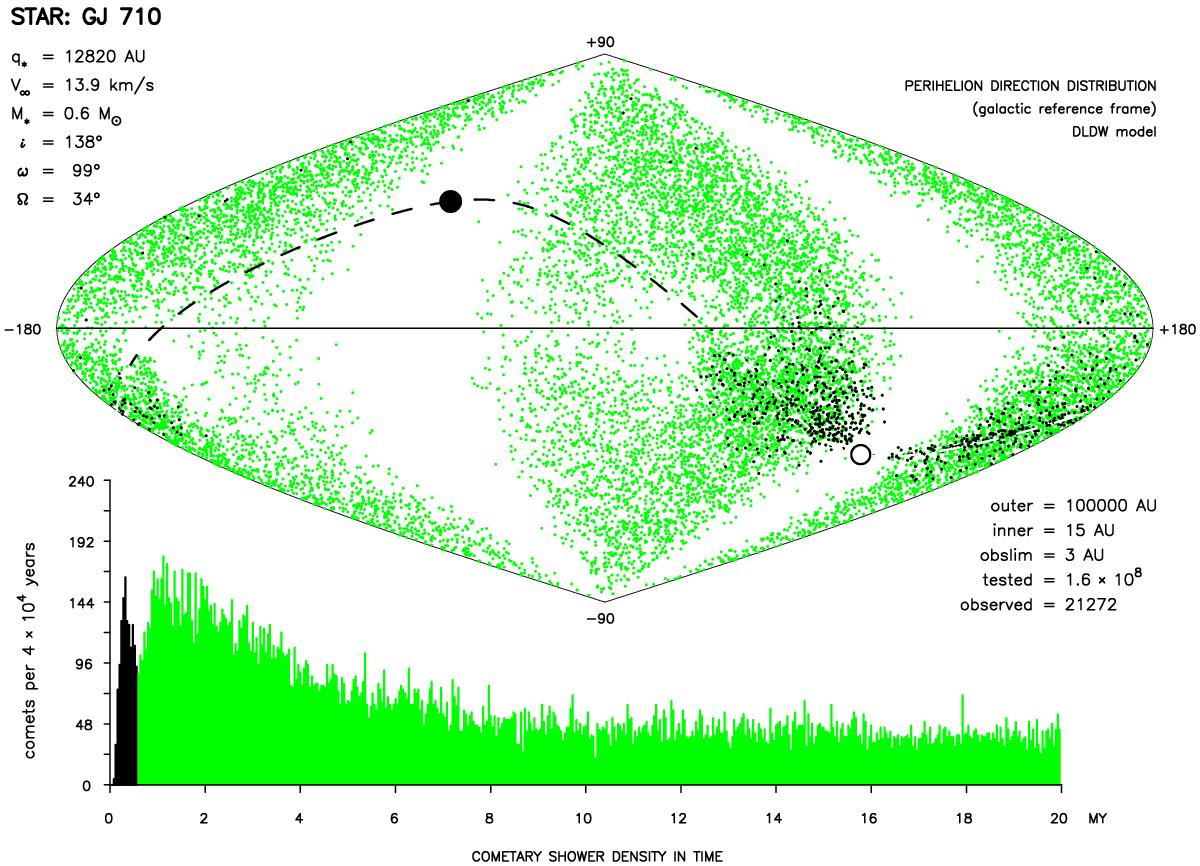
Structure of the observable comet swarm triggered by Gliese 710. The initial parameters of the star are presented in the upper left corner while the parameters of the simulation are shown in the lower right one. The DLDW model (Dones et al. 1998) of the cloud was used. The projection of the GJ 710 heliocentric orbit is marked by a dashed line. The stellar perihelion (the position at the proximity) is shown as a big, black dot, while the small open circle denotes its anti-perihelion direction. The observable comet influx begins shortly after the star passage and gains its maximum 1 Myr later.
Current usage metrics show cumulative count of Article Views (full-text article views including HTML views, PDF and ePub downloads, according to the available data) and Abstracts Views on Vision4Press platform.
Data correspond to usage on the plateform after 2015. The current usage metrics is available 48-96 hours after online publication and is updated daily on week days.
Initial download of the metrics may take a while.