Fig. 2
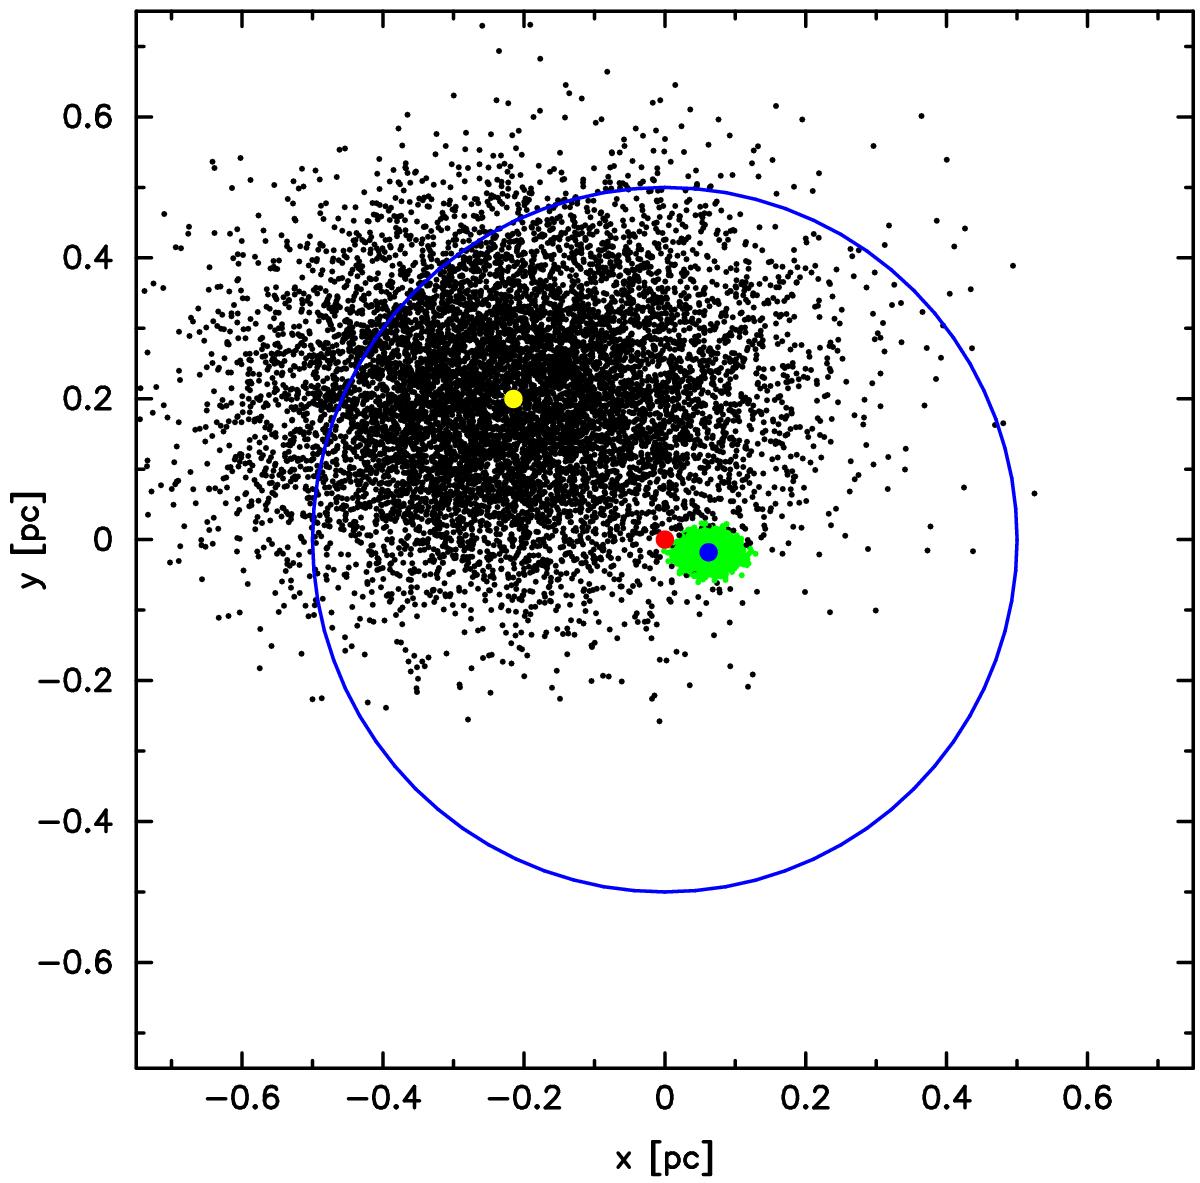
Comparison of distributions of clones from Gaia and Hipparcos data, presented on the same plane as in Fig. 1. Black points represent the positions of clones from the HIP2 catalogue, and green dots represent those from Gaia DR1. Yellow and blue dots represent the nominal solutions for HIP2 and Gaia DR1, respectively. A red point shows the position of the Sun. The blue circle depicts the size of the Oort cloud.
Current usage metrics show cumulative count of Article Views (full-text article views including HTML views, PDF and ePub downloads, according to the available data) and Abstracts Views on Vision4Press platform.
Data correspond to usage on the plateform after 2015. The current usage metrics is available 48-96 hours after online publication and is updated daily on week days.
Initial download of the metrics may take a while.