Fig. A.3
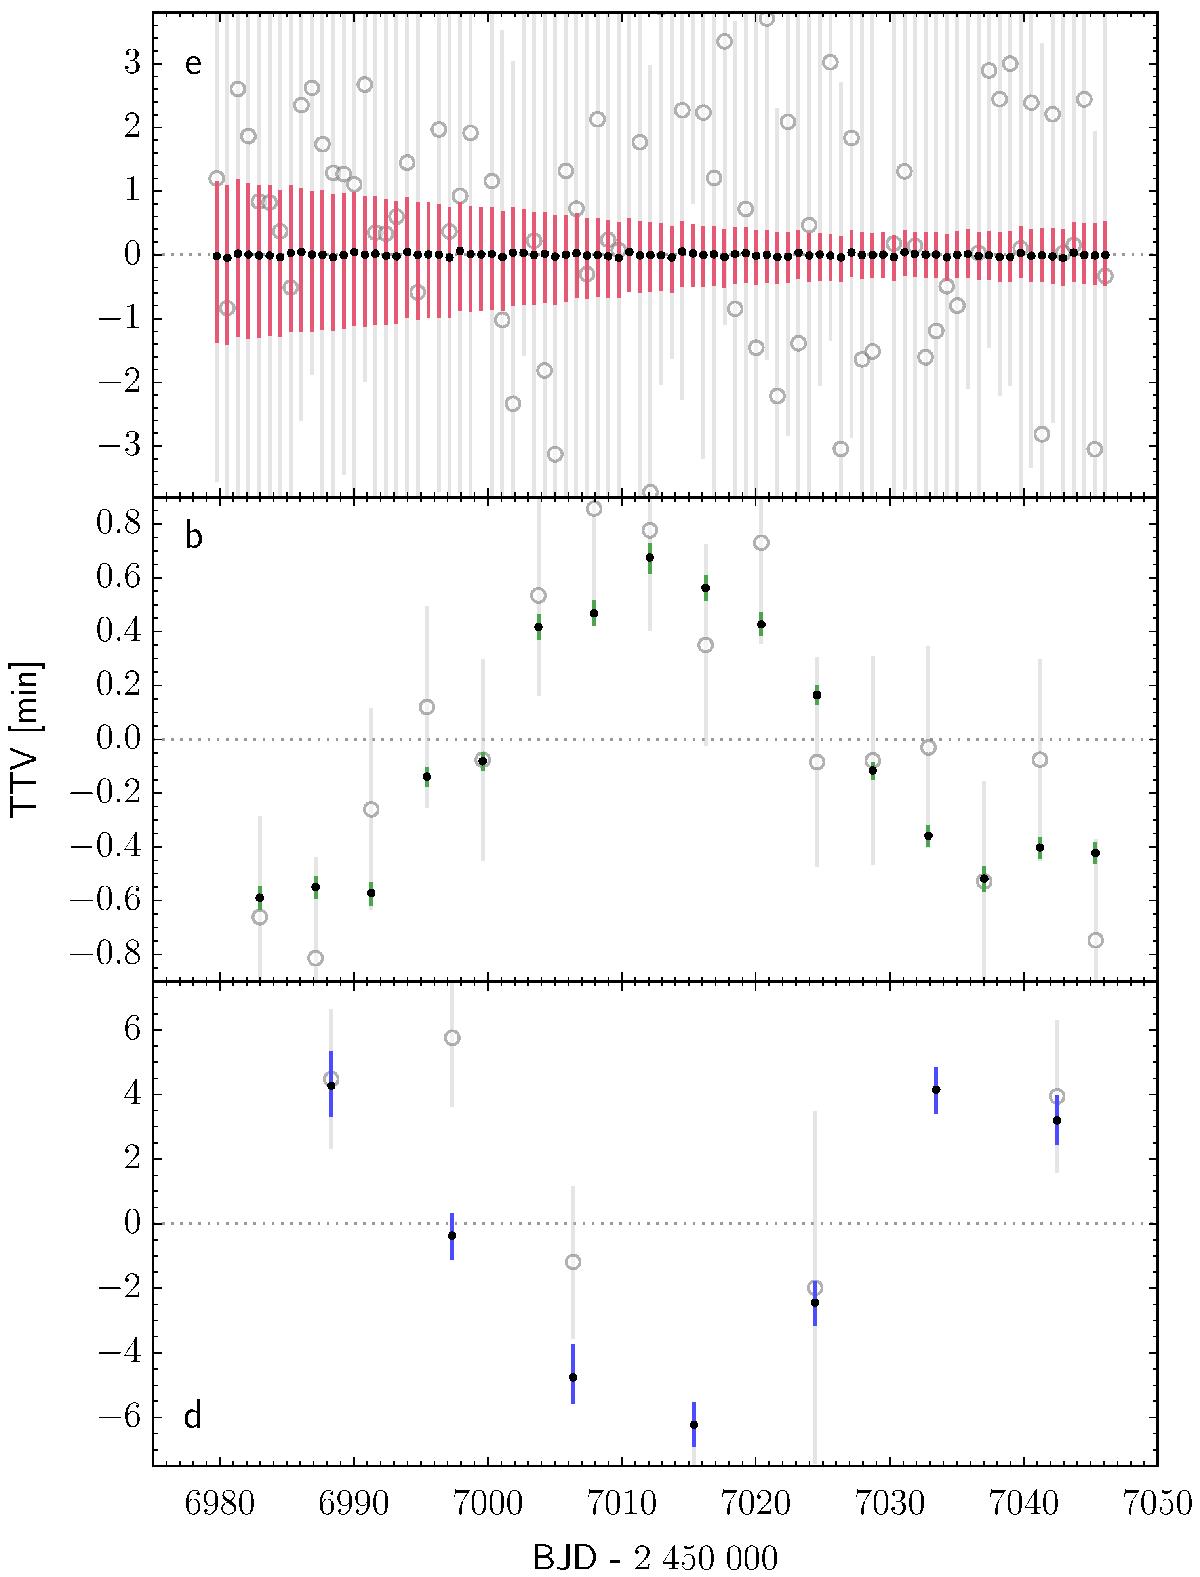
Posterior TTV of planets e), b), and d) (from top to bottom). Black dots with coloured error bars are the posterior TTV from the analysis (median and 68.3% confidence interval). The grey open circles are the Becker et al. (2015) TTV, measured individually from each observed transit. The gain in the mean transit times precision is a factor 9 for planets b) and e), and 3 for planet d).
Current usage metrics show cumulative count of Article Views (full-text article views including HTML views, PDF and ePub downloads, according to the available data) and Abstracts Views on Vision4Press platform.
Data correspond to usage on the plateform after 2015. The current usage metrics is available 48-96 hours after online publication and is updated daily on week days.
Initial download of the metrics may take a while.