Free Access
Fig. A.2
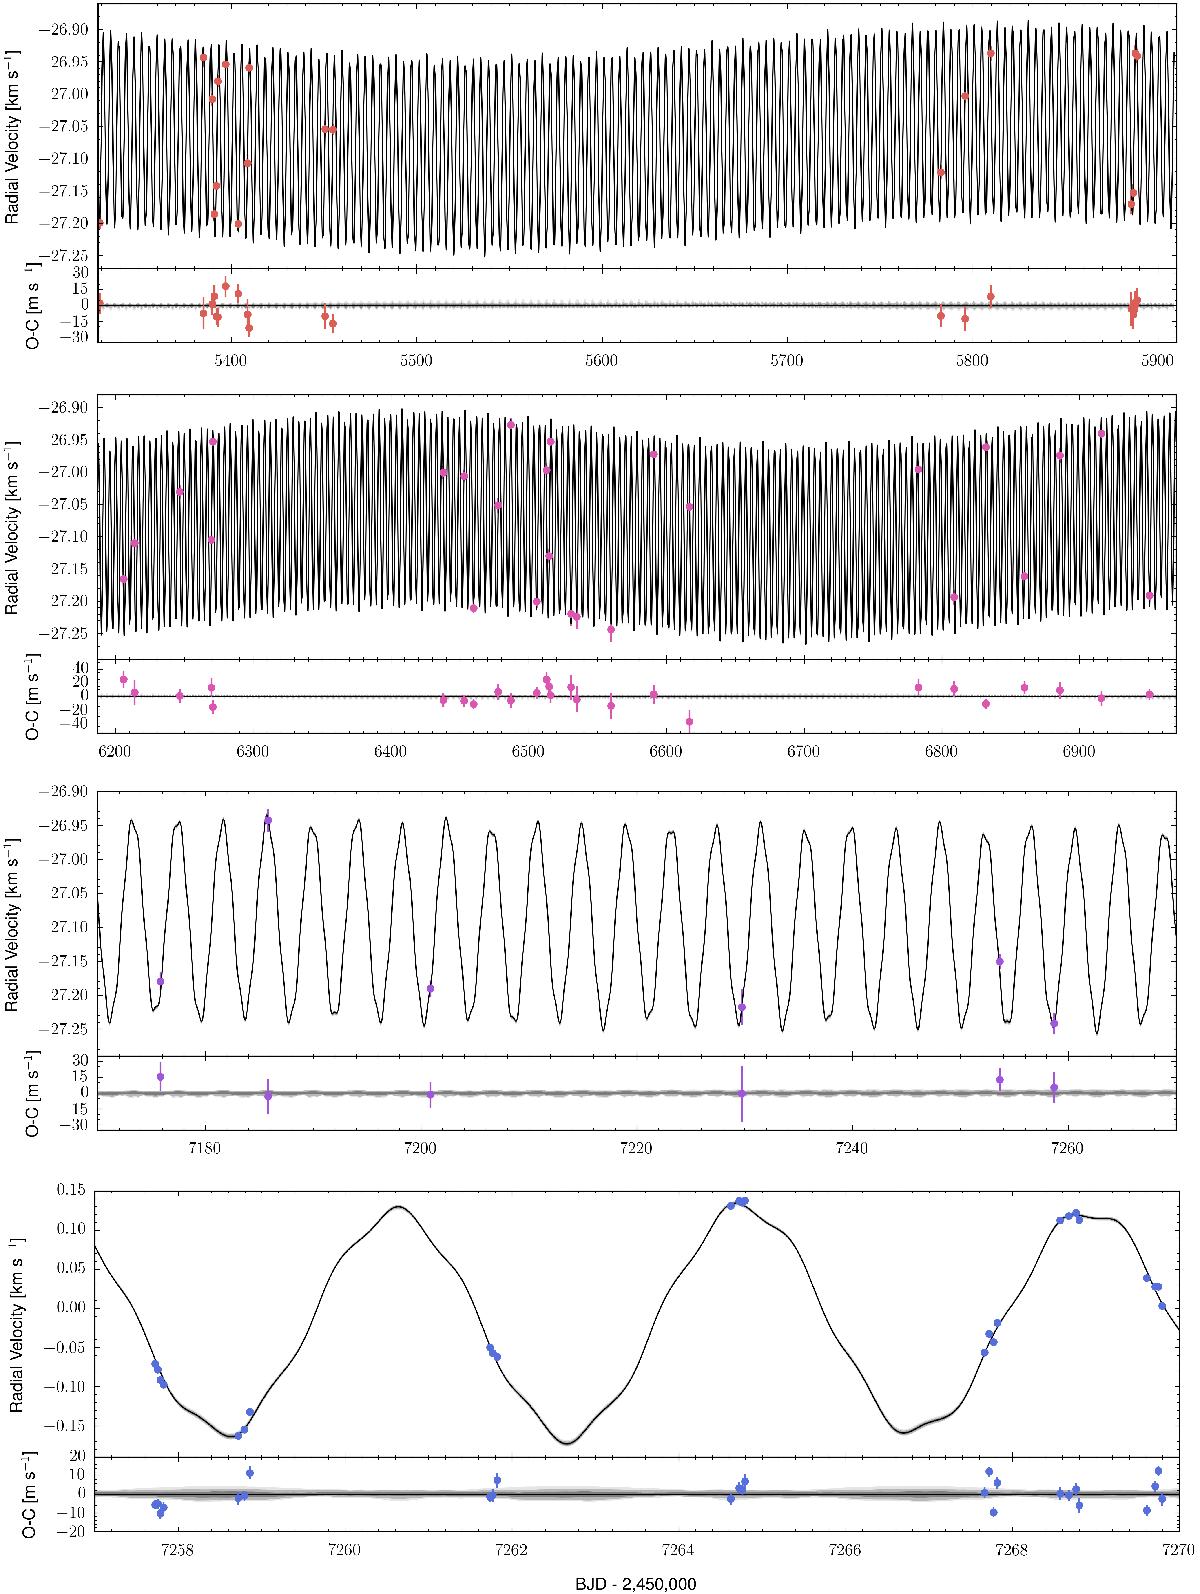
Idem Fig. A.1 for the radial velocity as a function of time. From top to bottom: CORALIE 2012, CORALIE 2016a, CORALIE 2016b, and PFS.
This figure is made of several images, please see below:
Current usage metrics show cumulative count of Article Views (full-text article views including HTML views, PDF and ePub downloads, according to the available data) and Abstracts Views on Vision4Press platform.
Data correspond to usage on the plateform after 2015. The current usage metrics is available 48-96 hours after online publication and is updated daily on week days.
Initial download of the metrics may take a while.