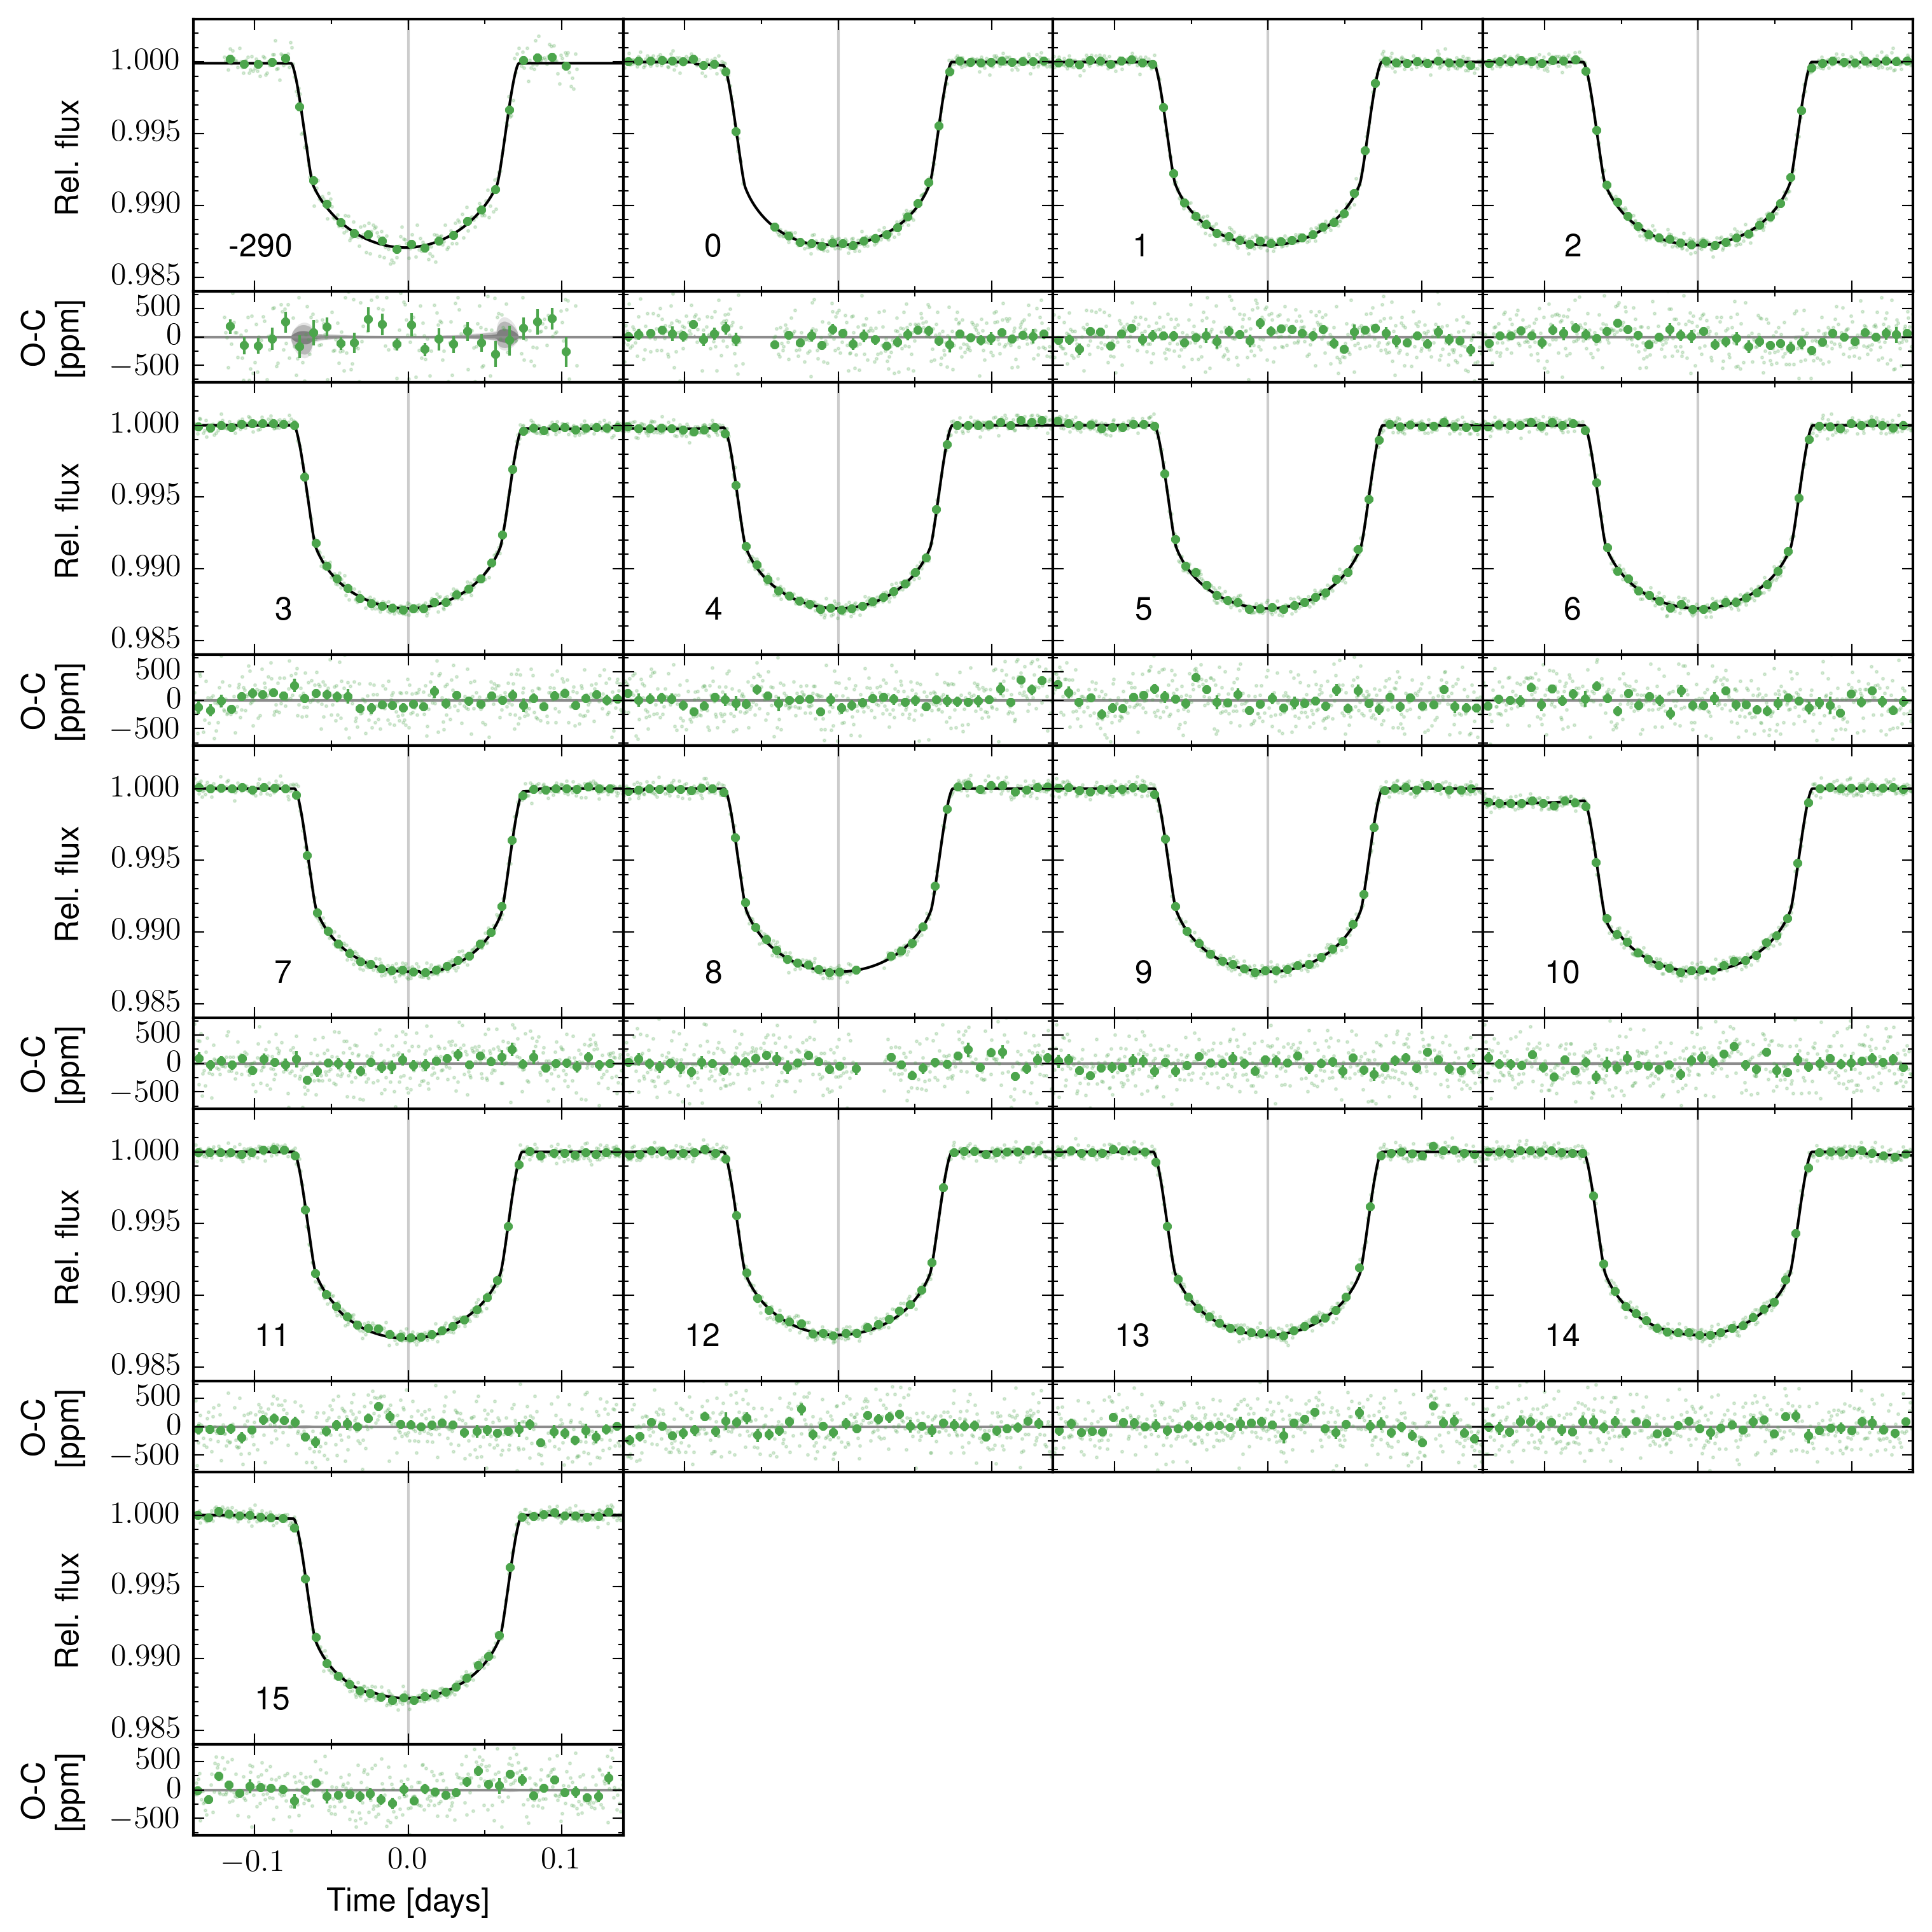
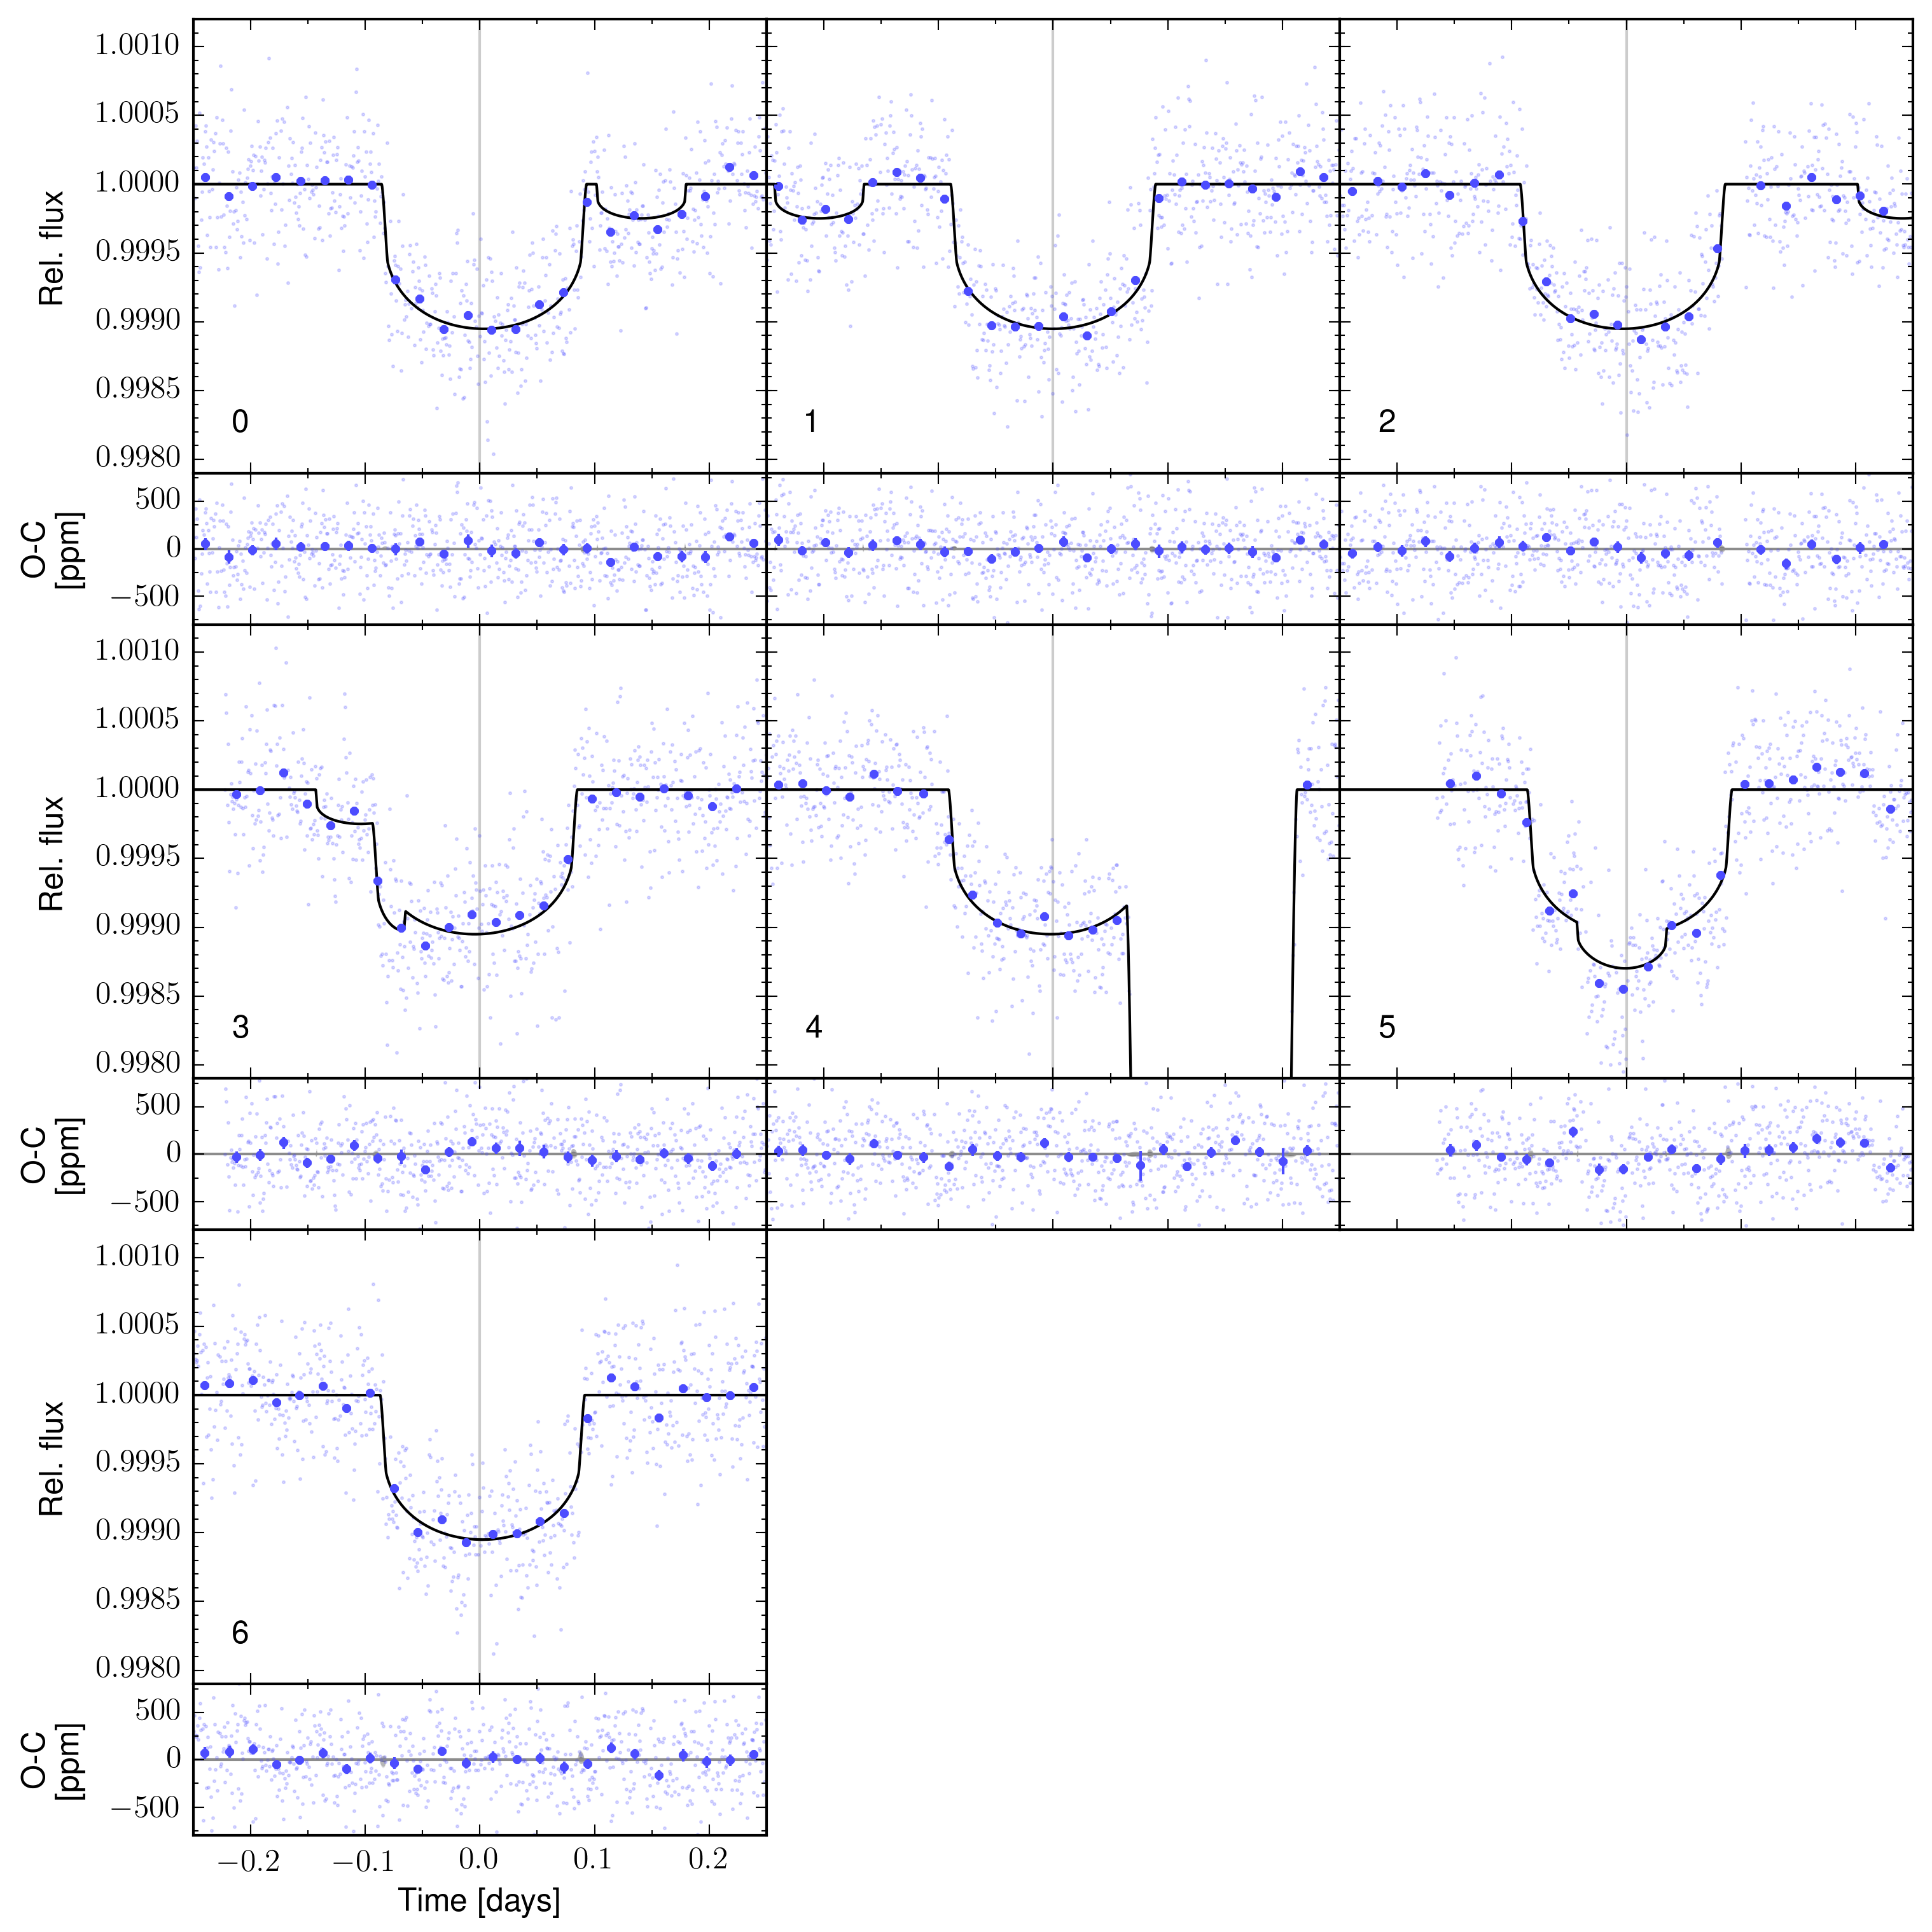
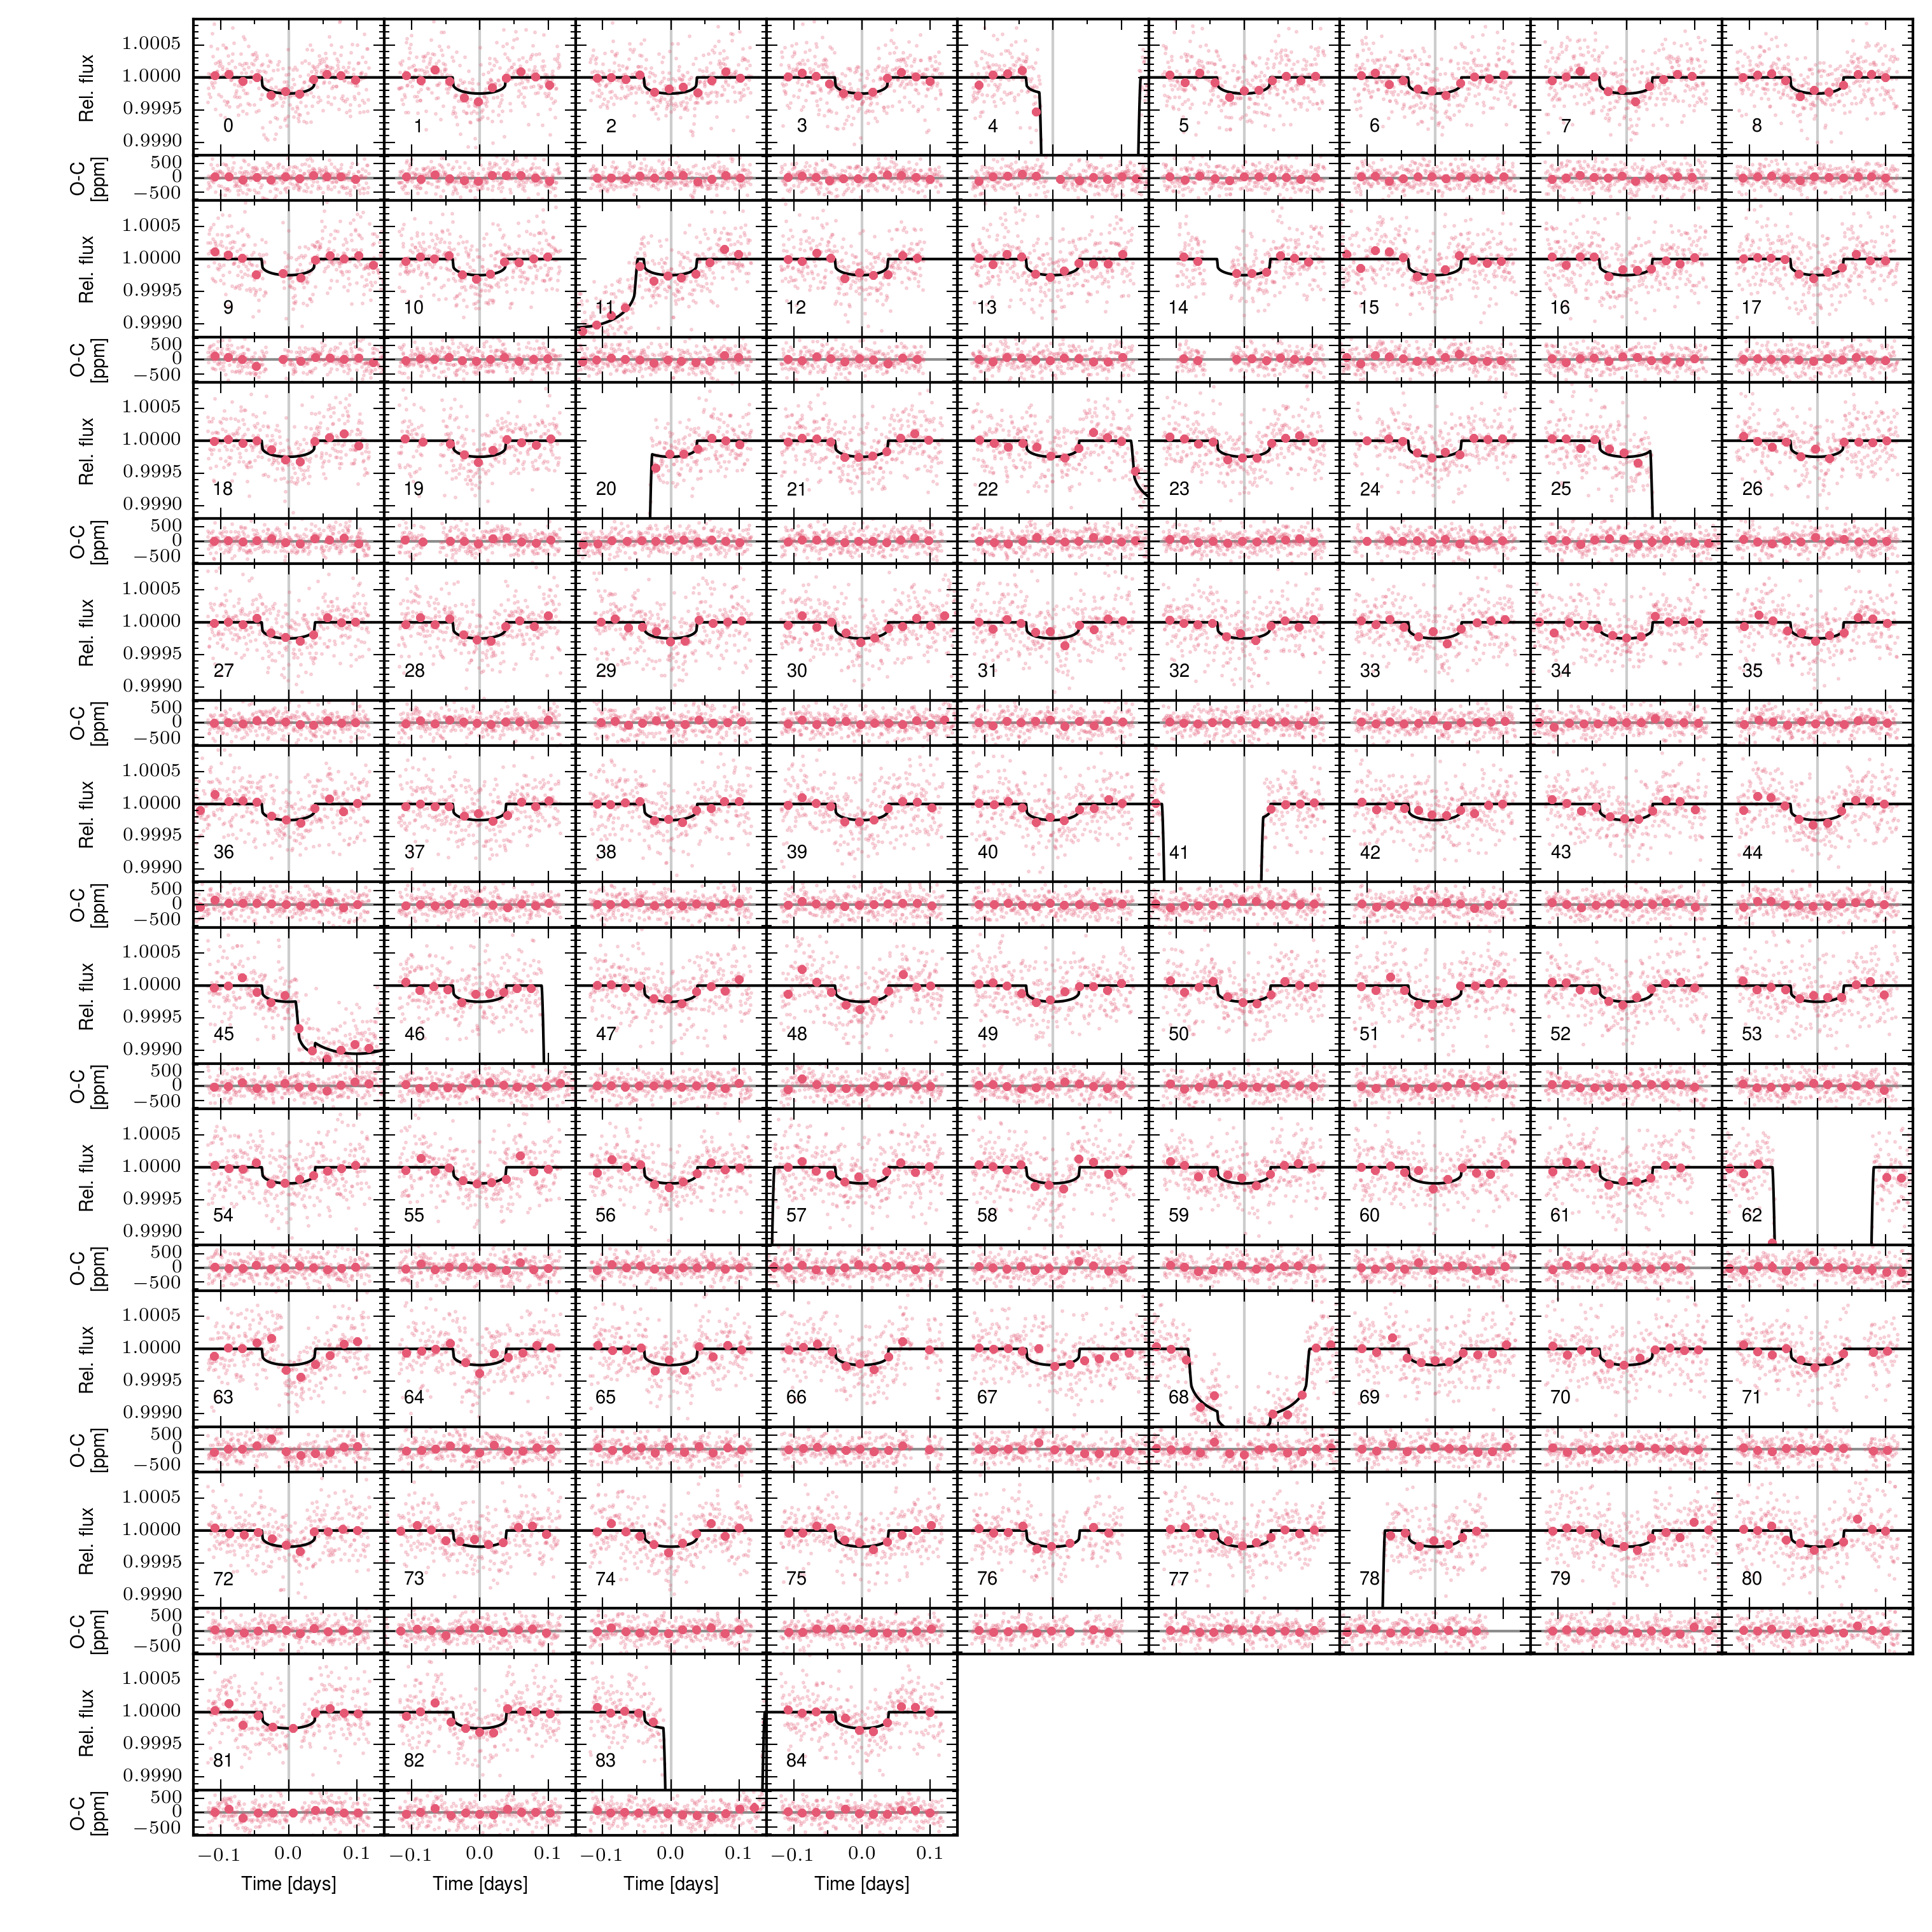
Fig. A.1
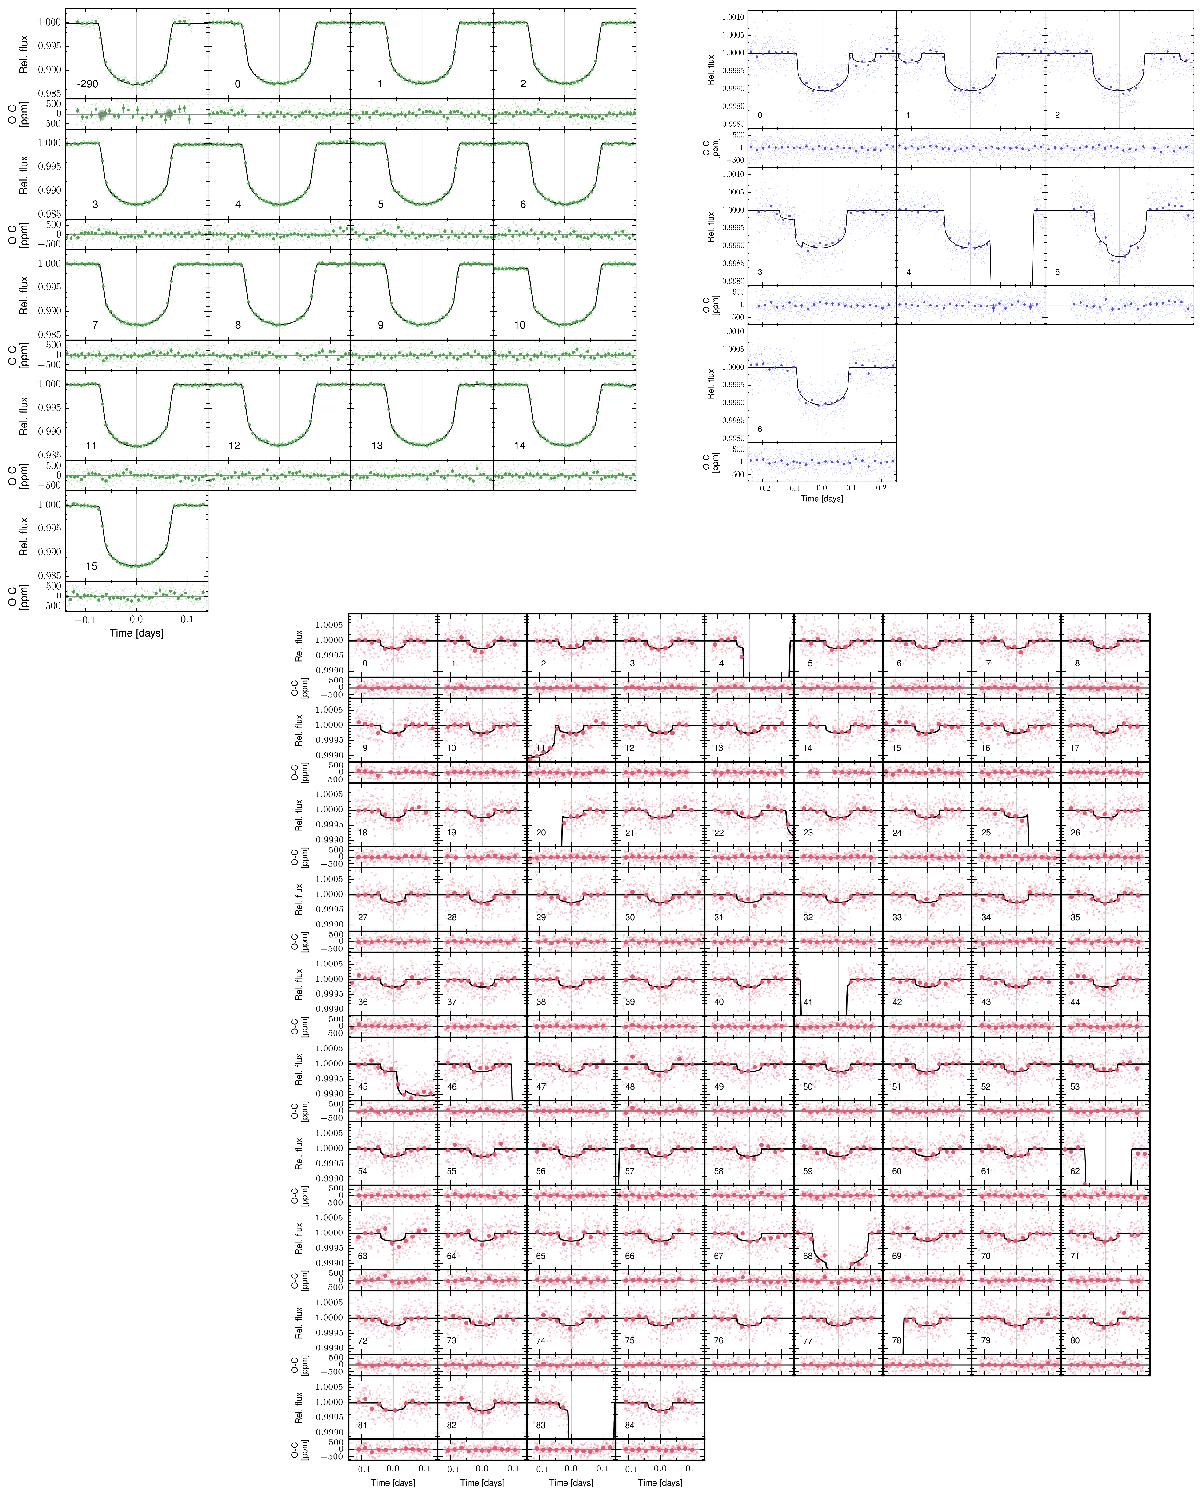
Photometric data of planets b) (top, left), d) (top, right), and e) (bottom). Each transit is centred relative to a linear ephemeris. Small dots represents the photometric data, whereas circles represent the data binned. Each panel is labelled with the epoch, with zero the first transit after tref. The black curve is the median value of the distribution of oversampled models corresponding to 1000 random MCMC steps, the different shades of grey represent the 68.3, 95.5, and 99.7% confidence intervals. In the lower part of each panel the residuals after subtracting the MAP model to the observed data are shown.
Current usage metrics show cumulative count of Article Views (full-text article views including HTML views, PDF and ePub downloads, according to the available data) and Abstracts Views on Vision4Press platform.
Data correspond to usage on the plateform after 2015. The current usage metrics is available 48-96 hours after online publication and is updated daily on week days.
Initial download of the metrics may take a while.