Fig. 2
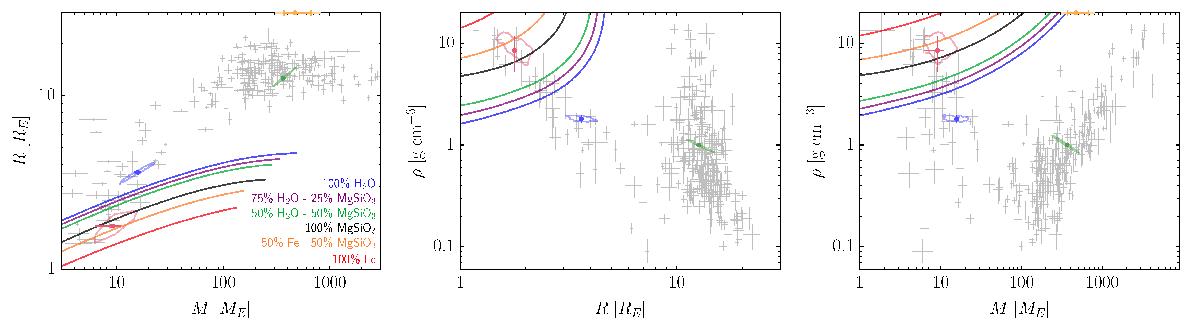
Mass-radius, radius-density, and mass-density diagrams for known exoplanets with parameters determined with a precision <50% (Han et al. 2014). The WASP-47 planets are shown as 68.3% coloured contours for the model-free photodynamical analysis and as dots with 1σ error bars for the analysis using the Dartmouth model (planet b in green, planet c in orange, planet d in blue, and planet e in red). Planet c, whose radius and density are not known, is represented at the top of the mass-radius and mass-density diagrams. The solid lines represent theoretical models for different composition (Zeng & Sasselov 2013).
Current usage metrics show cumulative count of Article Views (full-text article views including HTML views, PDF and ePub downloads, according to the available data) and Abstracts Views on Vision4Press platform.
Data correspond to usage on the plateform after 2015. The current usage metrics is available 48-96 hours after online publication and is updated daily on week days.
Initial download of the metrics may take a while.