Free Access
Fig. 3
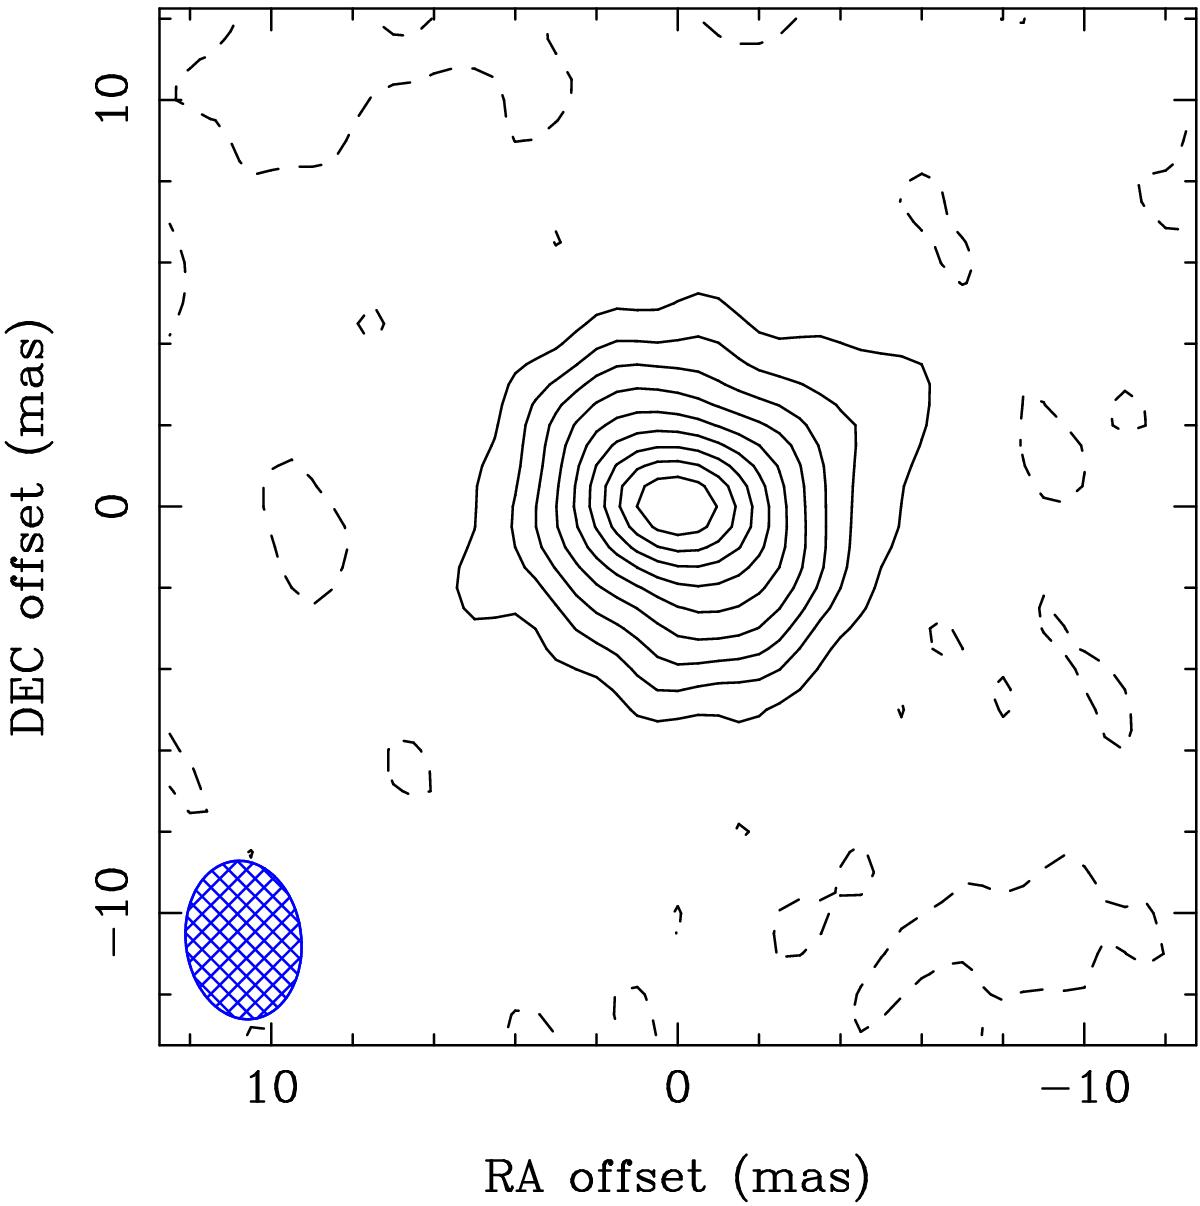
VLBI image of SN 1978K at a frequency of 8.4 GHz on 2015 March 29. The map is centered at 03:17:38.62, −66:33:03.4 (J2000). The beam shown at lower-left by the hashed ellipse is 3.9 mas × 2.8 mas. Contours are shown at − 2%, 10%, 20%, 30%,..., 90% of the peak brightness of 1.95 mJy/beam.
Current usage metrics show cumulative count of Article Views (full-text article views including HTML views, PDF and ePub downloads, according to the available data) and Abstracts Views on Vision4Press platform.
Data correspond to usage on the plateform after 2015. The current usage metrics is available 48-96 hours after online publication and is updated daily on week days.
Initial download of the metrics may take a while.