Free Access
Fig. 9
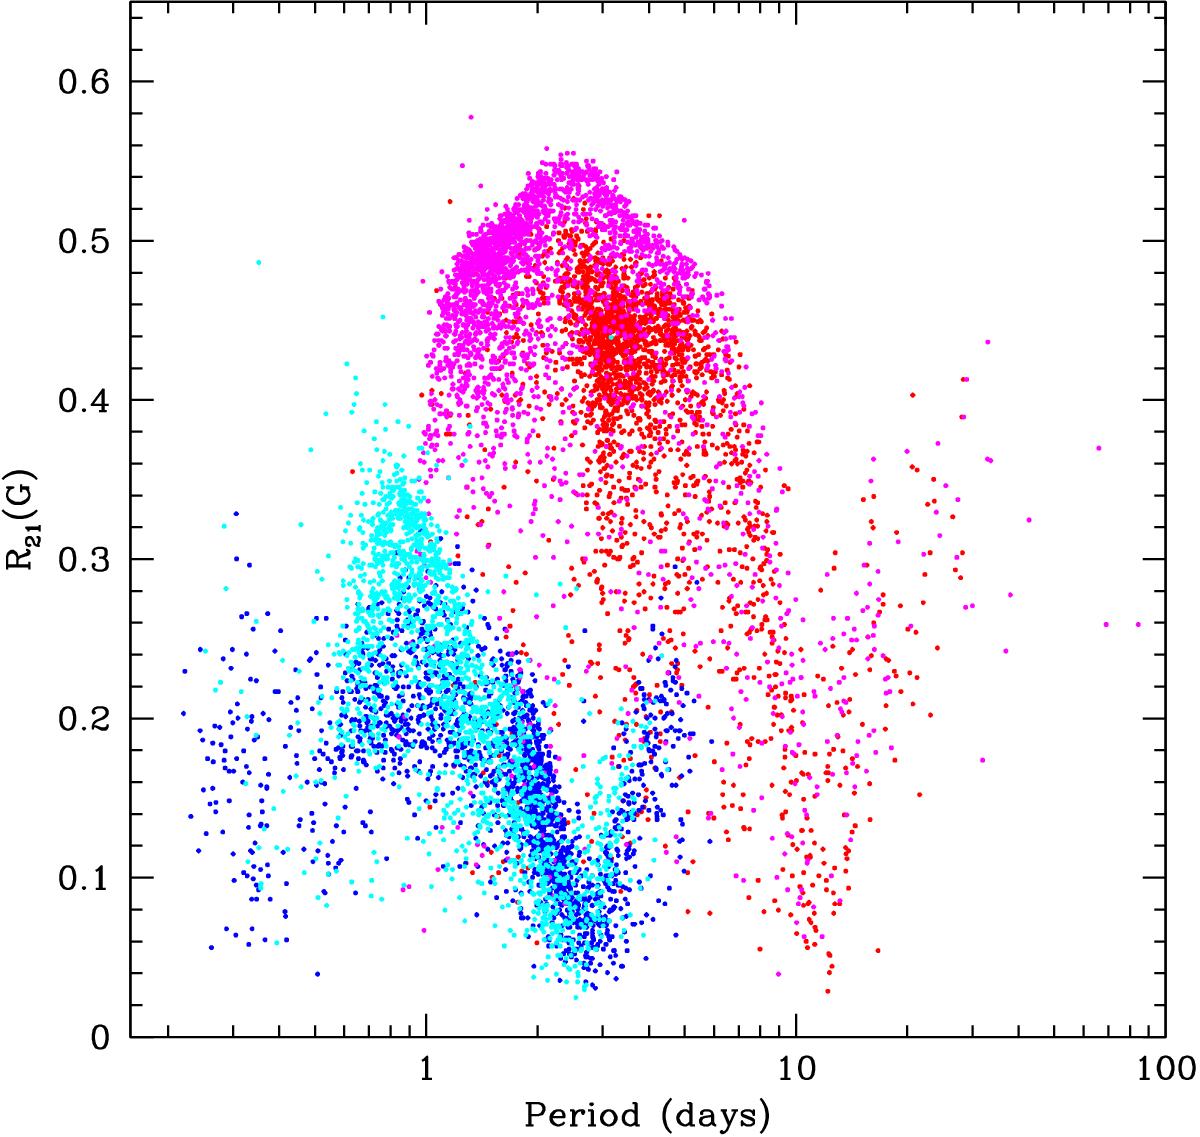
G-band R21 vs. period diagram for DCEPs in the Magellanic Clouds (red: F, blue: 1O DCEPs in the LMC; magenta: F, cyan: 1O DCEPs in the SMC). The figure was obtained by transforming the I-band R21 values in Soszynski et al. (2008a, 2010a, 2015b,c) to the G-band using eq. (16) (see text for details).
Current usage metrics show cumulative count of Article Views (full-text article views including HTML views, PDF and ePub downloads, according to the available data) and Abstracts Views on Vision4Press platform.
Data correspond to usage on the plateform after 2015. The current usage metrics is available 48-96 hours after online publication and is updated daily on week days.
Initial download of the metrics may take a while.