Free Access
Fig. 11
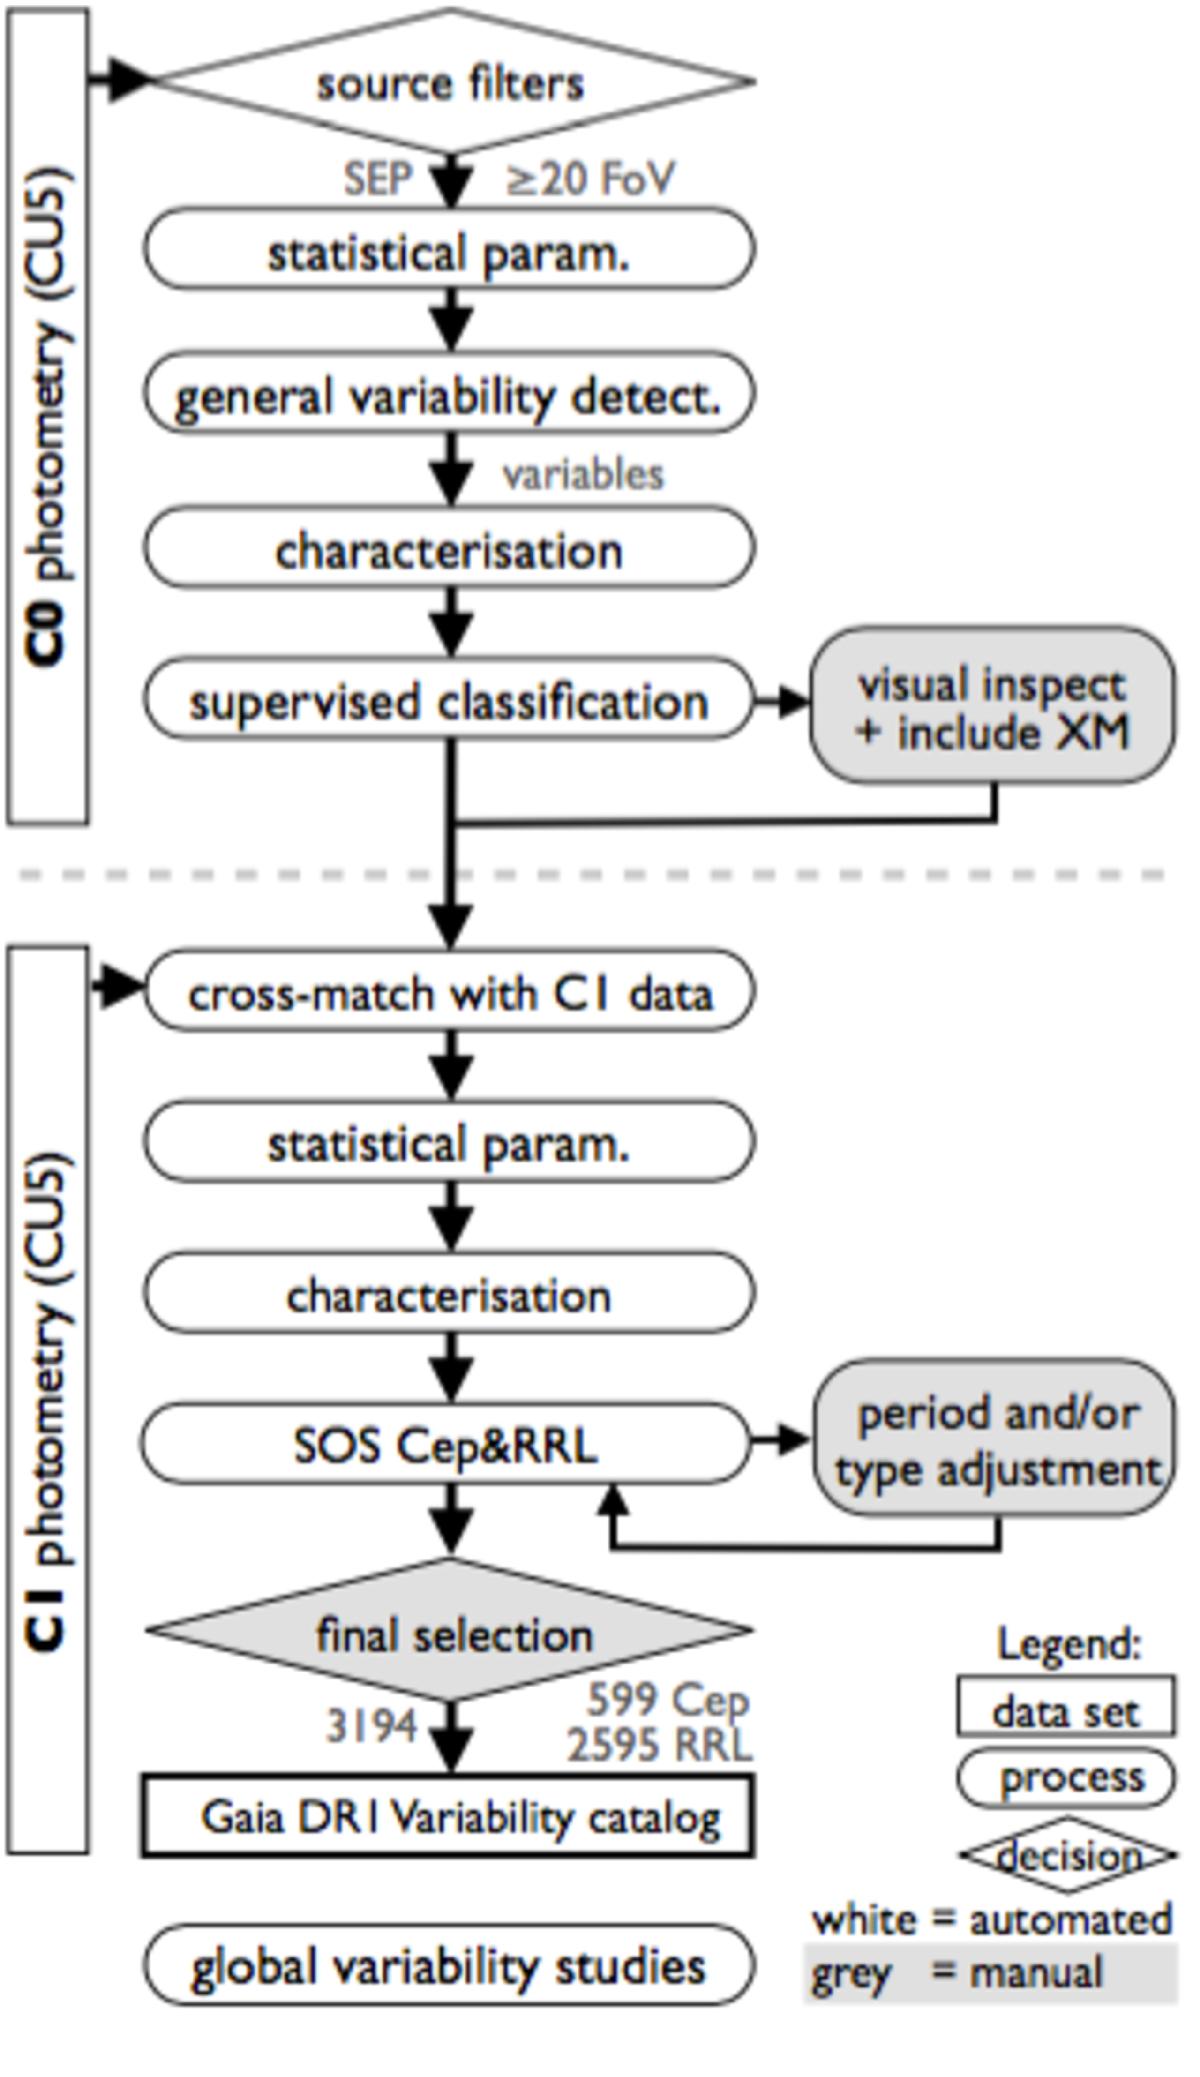
Flow chart summarising the global variable star analysis pipeline adopted for Gaia first data release. See Fig. 10 in Eyer et al. (2016) for a more detailed version of this figure.
Current usage metrics show cumulative count of Article Views (full-text article views including HTML views, PDF and ePub downloads, according to the available data) and Abstracts Views on Vision4Press platform.
Data correspond to usage on the plateform after 2015. The current usage metrics is available 48-96 hours after online publication and is updated daily on week days.
Initial download of the metrics may take a while.