Fig. 10
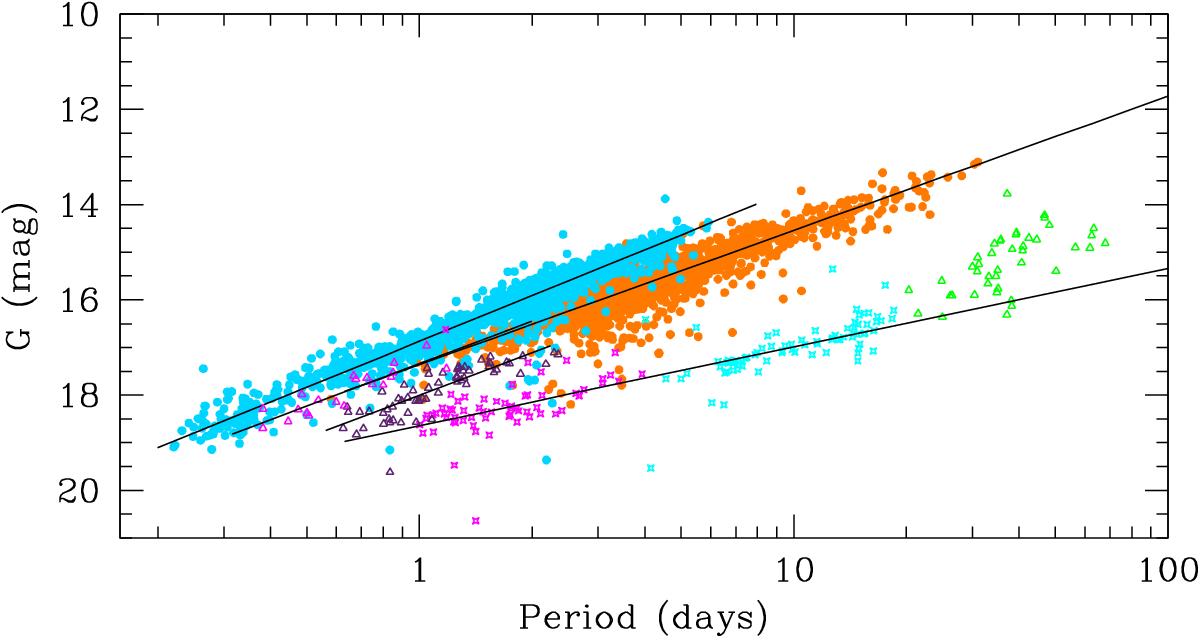
G-band PL distribution of DCEPs, ACEPs, and T2CEPs in the LMC obtained transforming the OGLE V,I magnitudes to the G-band by means of Eq. (A.1). Overlaid are the PL relations described by Eqs. (20)−(24). Cyan filled circles: DECPs 1O; orange filled circles: DCEPs F; cyan four-starred symbols: ACEPs F; magenta four-starred symbols: ACEPs 1O; green open triangles: RVTAU; violet open triangles: WVIR; magenta open triangles: BLHER.
Current usage metrics show cumulative count of Article Views (full-text article views including HTML views, PDF and ePub downloads, according to the available data) and Abstracts Views on Vision4Press platform.
Data correspond to usage on the plateform after 2015. The current usage metrics is available 48-96 hours after online publication and is updated daily on week days.
Initial download of the metrics may take a while.