Fig. 1
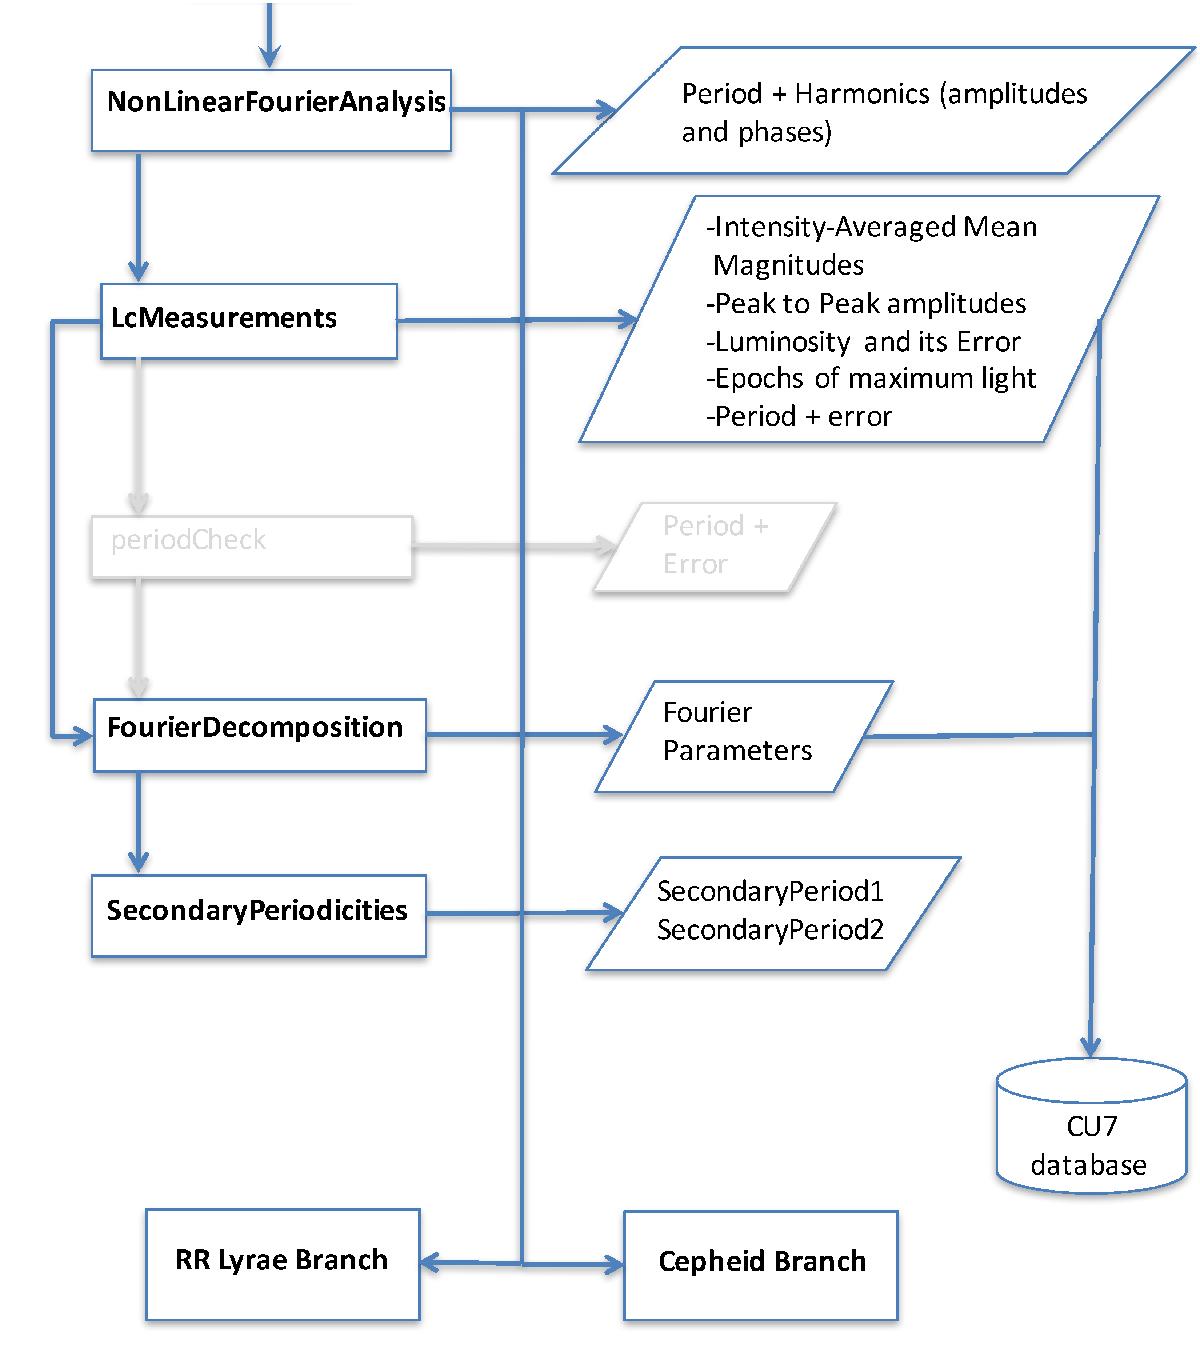
Flow chart of the SOS Cep&RRL pipeline that is common to both Cepheid and RR Lyrae star processing. Boxes on the left-hand side show different modules of this general trunk, their outputs are indicated within rhombs on the right-hand side. Blue arrows connect modules activated for the processing of Gaia DR1 data, their names are highlighted in bold-face. We have marked in light grey modules not operational for the Gaia DR1 processing and their connections to the rest of the pipeline.
Current usage metrics show cumulative count of Article Views (full-text article views including HTML views, PDF and ePub downloads, according to the available data) and Abstracts Views on Vision4Press platform.
Data correspond to usage on the plateform after 2015. The current usage metrics is available 48-96 hours after online publication and is updated daily on week days.
Initial download of the metrics may take a while.