Free Access
Fig. A.2
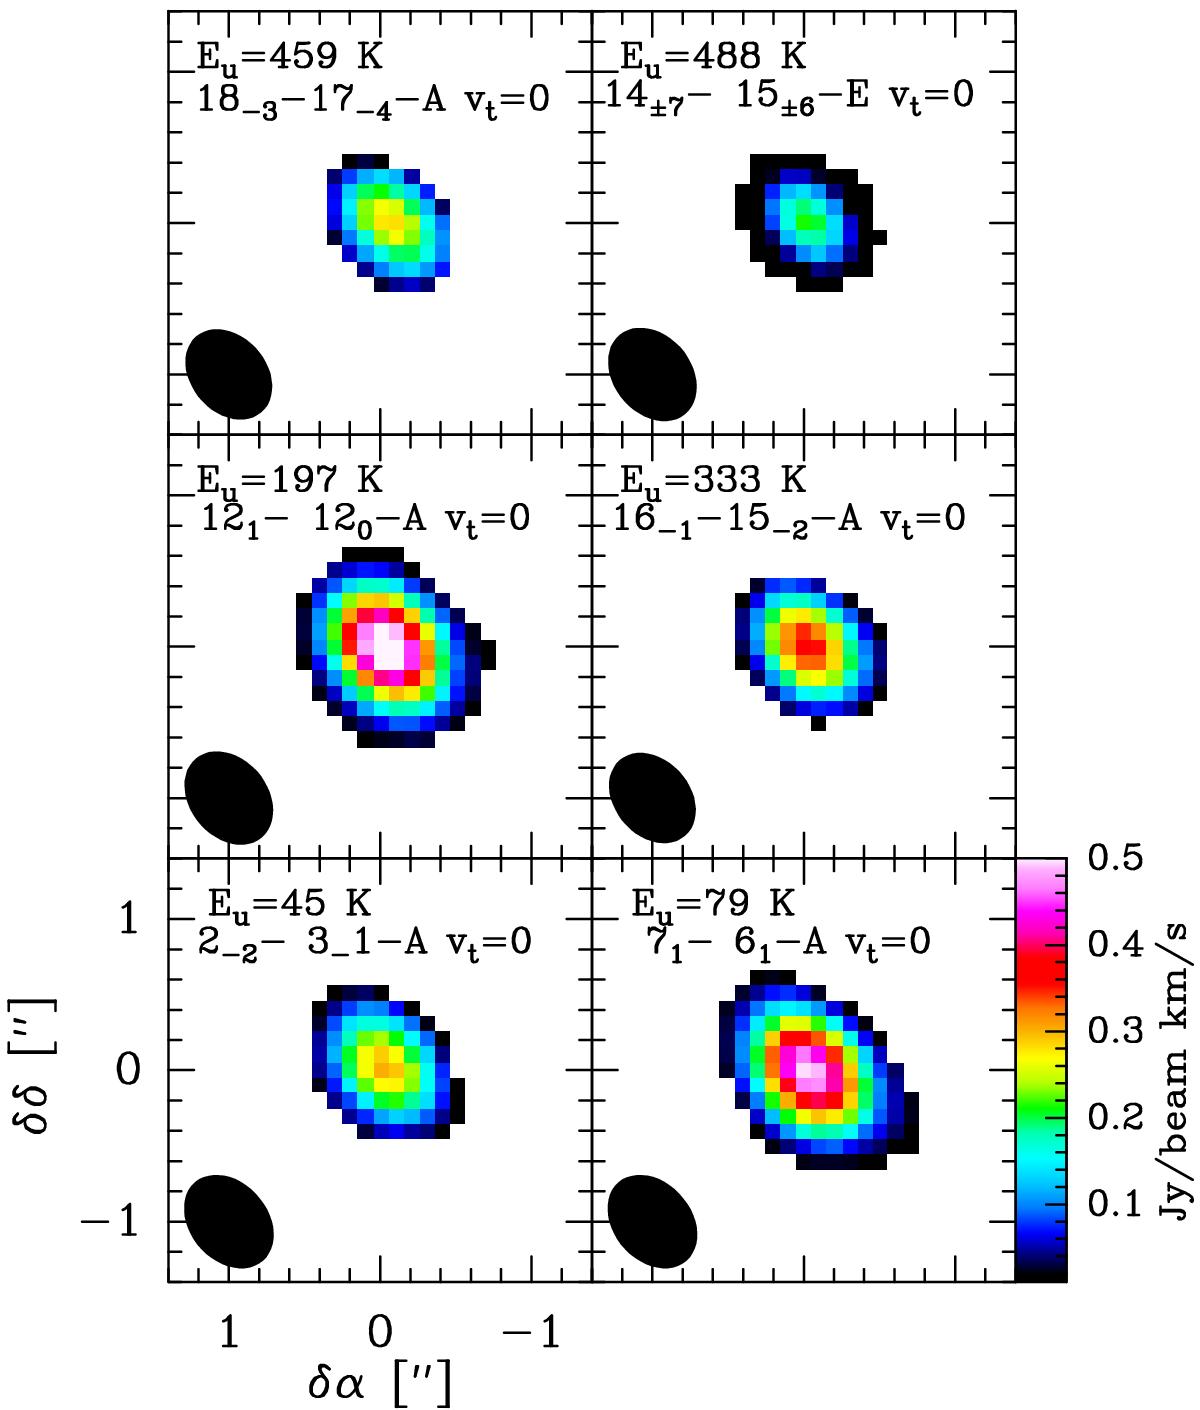
Integrated intensity maps of different methanol transitions. In each panel, the filled ellipse shows the synthesised beam of the corresponding map. To identify the lines, the upper energy of each transition is also indicated.
Current usage metrics show cumulative count of Article Views (full-text article views including HTML views, PDF and ePub downloads, according to the available data) and Abstracts Views on Vision4Press platform.
Data correspond to usage on the plateform after 2015. The current usage metrics is available 48-96 hours after online publication and is updated daily on week days.
Initial download of the metrics may take a while.