Fig. A.1
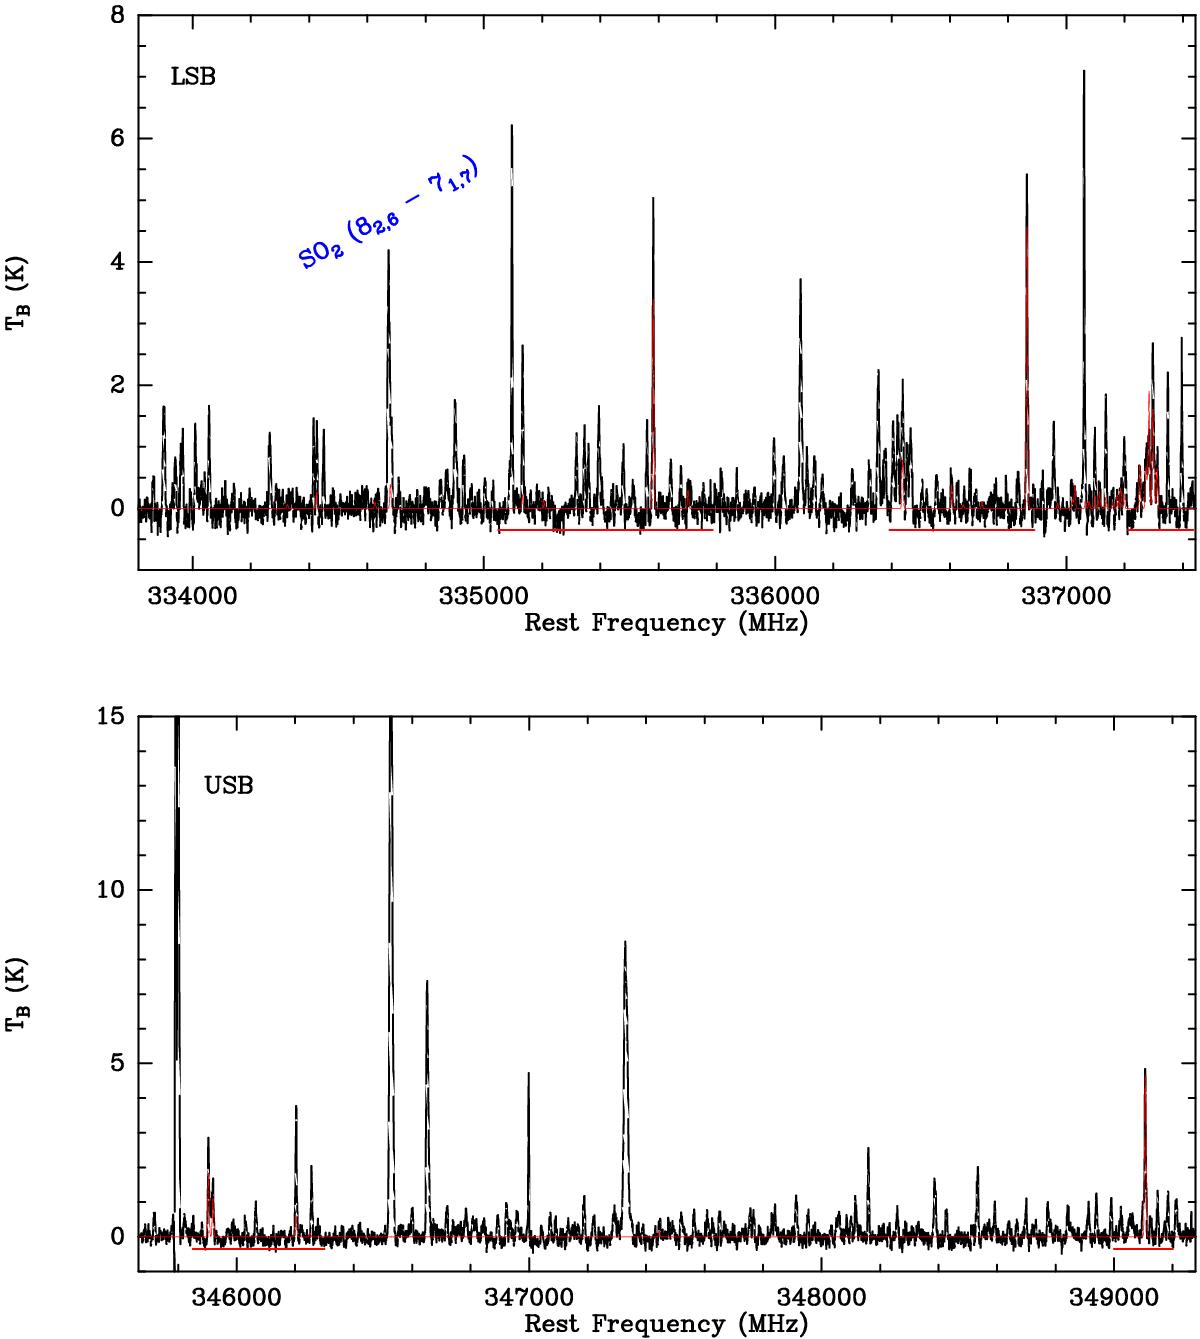
Full spectrum extracted at the dust peak position HH 212-MM1 (top panel: lower side band data; lower panel: upper side band data). The horizontal red lines mark the regions of the spectrum plotted in Fig. 2 where most of the methanol lines are found. The best fit LTE synthetic spectrum of methanol is displayed in red over the full 8 GHz bandwidth. In the upper panel, the SO2(82,6–71,7) is marked because it overlaps with a CH3OH line (the 25-3–24-2−E,νt = 1 transition, Eu= 1078 K). This methanol line was not included in the fit.
Current usage metrics show cumulative count of Article Views (full-text article views including HTML views, PDF and ePub downloads, according to the available data) and Abstracts Views on Vision4Press platform.
Data correspond to usage on the plateform after 2015. The current usage metrics is available 48-96 hours after online publication and is updated daily on week days.
Initial download of the metrics may take a while.