Fig. 4
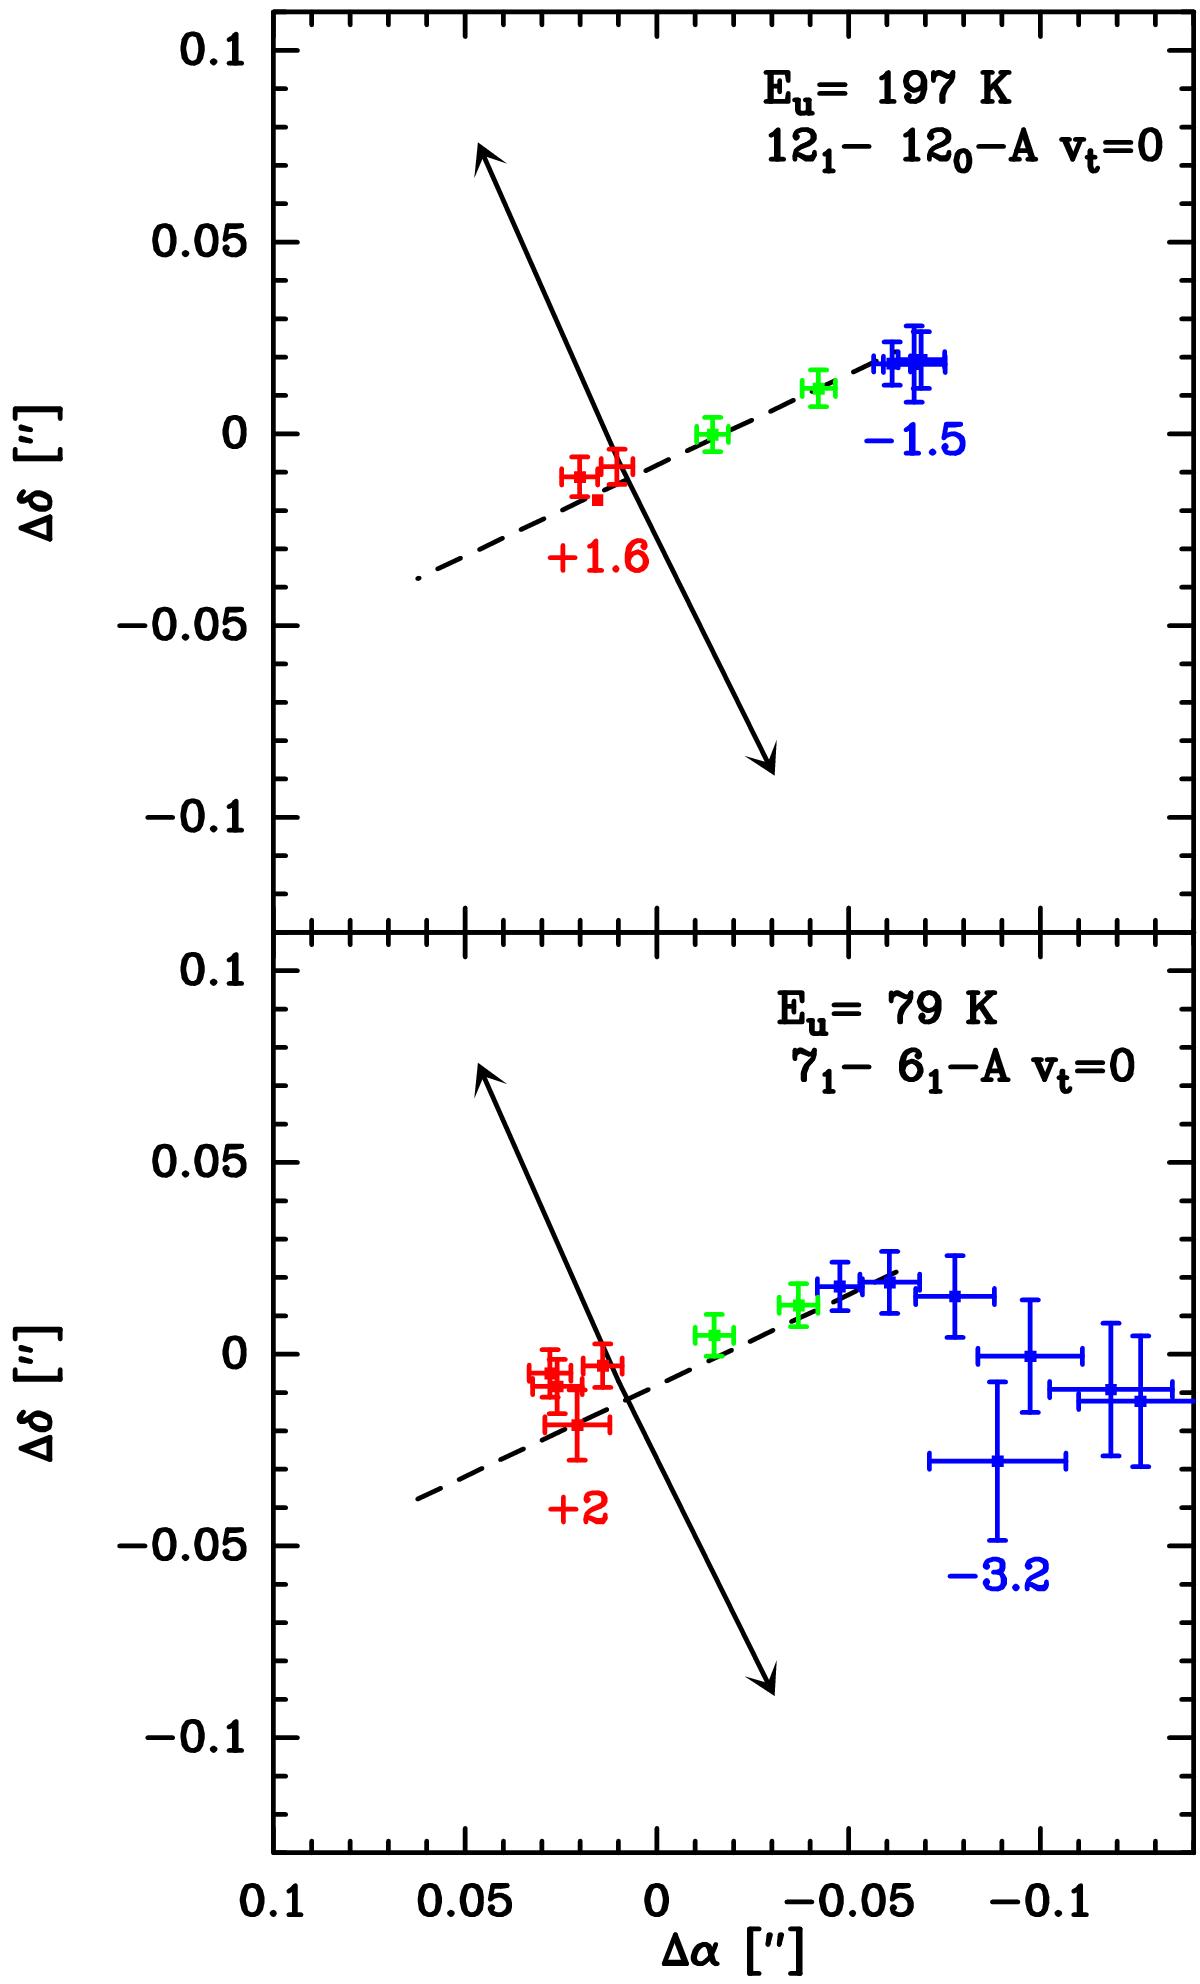
Distribution of the centroid positions of various velocity channels of the 71–61-A, νt = 0 (bottom) and 12-1–120-A, νt = 0 (top) lines. In both panels, the velocity of the most blue- and red-shifted channels are subtracted by the systemic velocity. The velocity channels close to systemic velocity are marked in green. The arrows indicate the direction of the SiO jet; the dashed line traces the equatorial plane.
Current usage metrics show cumulative count of Article Views (full-text article views including HTML views, PDF and ePub downloads, according to the available data) and Abstracts Views on Vision4Press platform.
Data correspond to usage on the plateform after 2015. The current usage metrics is available 48-96 hours after online publication and is updated daily on week days.
Initial download of the metrics may take a while.